gplotmatrix
Matrix of scatter plots by group
Syntax
Description
gplotmatrix(
creates a matrix of scatter plots and histograms of the data in X,[],group)X,
grouped by the grouping variable in group. Each off-diagonal plot in
the resulting figure is a scatter plot of a column of X against
another column of X. The software also plots the outlines of the
grouped histograms in the diagonal plots of the plot matrix. X and
group must have the same number of rows.
gplotmatrix(
creates a matrix of scatter plots. Each plot in the resulting figure is a scatter plot of
a column of X,Y,group)X against a column of Y. For
example, if X has p columns and
Y has q columns, then the figure contains a
q-by-p matrix of scatter plots. All plots are
grouped by the grouping variable group. The input arguments
X, Y, and group must all
have the same number of rows.
gplotmatrix(
labels the x-axes and y-axes of the scatter
plots using the column names specified in X,[],group,clr,sym,siz,doleg,dispopt,xnam)xnam. The input argument
xnam must contain one name for each column of
X. Set dispopt to
'variable' to display the variable names along the diagonal of the
scatter plot matrix.
gplotmatrix( creates
the scatter plot matrix in the figure or panel specified by parent,___)parent.
Specify parent as the first input argument followed by any of the
input argument combinations in the previous syntaxes.
Examples
Scatter Plots with Grouped Data
Create a matrix of scatter plots for each combination of variables in a data set. Group the data according to a separate variable.
Load the fisheriris data set, which contains flower data. The four columns of meas are the sepal length, sepal width, petal length, and petal width of the flowers. species contains the flower species names: setosa, versicolor, and virginica. Visually compare the flower measurements across flower species.
load fisheriris
gplotmatrix(meas,[],species)
In the matrix of scatter plots, the x-axis of the leftmost column of scatter plots corresponds to sepal length, the first column in meas. Similarly, the y-axis of the bottom row of scatter plots corresponds to petal width, the last column in meas. Therefore, the scatter plot in the bottom left of the matrix compares sepal length values (along the x-axis) to petal width values (along the y-axis). The color of each point depends on the species of the flower.
The diagonal plots are histograms rather than scatter plots. For example, the plot in the top left of the matrix shows the distribution of sepal length values for each species of flower.
Create Scatter Plot Matrix with Subset of Variables
Create scatter plots comparing a subset of the variables in a data set to another subset of variables. Group the data according to a separate variable.
Load the discrim data set.
load discrimThe ratings array contains rating values of 329 US cities for the nine categories listed in the categories array. The group array contains a city size code that is equal to 2 for the 26 largest cities, and 1 otherwise.
Create a matrix of scatter plots to compare the first two categories, climate and housing, with the fourth and seventh categories, crime and arts. Specify group as the grouping variable to visually distinguish the data for large and small cities.
X = ratings(:,1:2);
Y = ratings(:,[4 7]);
gplotmatrix(X,Y,group)
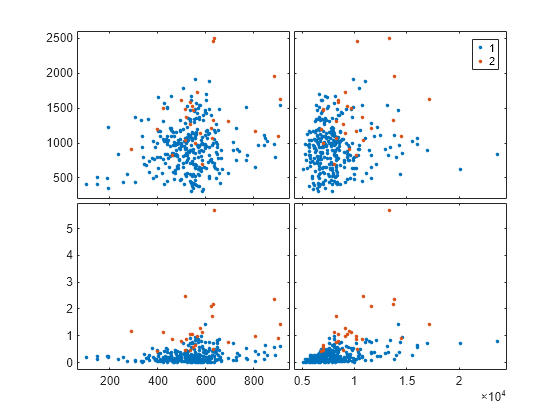
The matrix of scatter plots shows the specified comparisons, with each city size group represented by a different color.
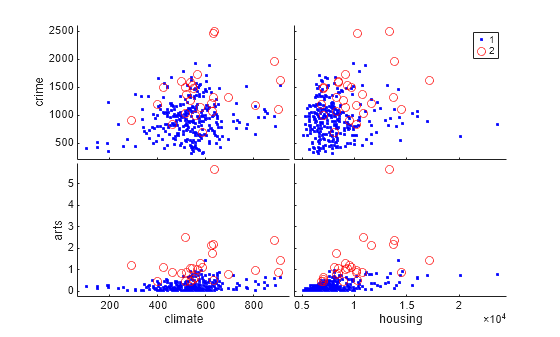
Adjust the appearance of the plots by specifying marker colors and symbols, and labeling the axes with the rating categories.
xnames = categories(1:2,:);
ynames = categories([4 7],:);
gplotmatrix(X,Y,group,'br','.o',[],'on',[],xnames,ynames)
Scatter Plot Matrix with Multiple Grouping Variables
Create a matrix of scatter plots comparing data variables by using two grouping variables.
Load the patients data set. Compare patient diastolic and systolic blood pressure values. Group the patients according to their gender and smoker status. Convert Smoker to a categorical variable to have more descriptive labels in the legend. Display grouped histograms along the diagonal of the plot matrix by using the 'grpbars' display option, and label the axes.
load patients
X = [Diastolic Systolic];
labeledSmoker = categorical(Smoker,[true false],{'Smoker','Nonsmoker'});
group = {Gender,labeledSmoker};
xnames = {'Diastolic','Systolic'};
gplotmatrix(X,[],group,[],[],[],[],'grpbars',xnames)
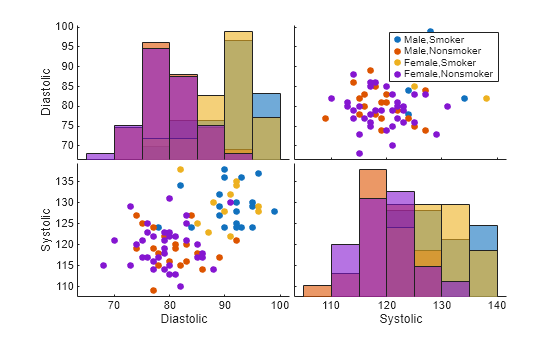
For example, the scatter plot in the bottom left of the matrix shows that smokers (blue and yellow markers) tend to have higher diastolic and systolic blood pressure values, regardless of gender.
Modify Scatter Plot Matrix Appearance
Create a matrix of scatter plots that display grouped data. Modify the appearance of one of the scatter plots.
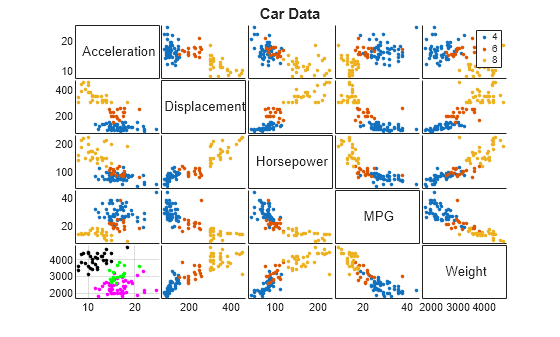
Load the carsmall data set. Create a scatter plot matrix using different car measurements. Group the cars by the number of cylinders. Display the car variable names along the diagonal of the plot matrix. Add a title to the plot matrix.
load carsmall
X = [Acceleration Displacement Horsepower MPG Weight];
xnames = {'Acceleration','Displacement','Horsepower','MPG','Weight'};
[h,ax] = gplotmatrix(X,[],Cylinders,[],[],[],[],'variable',xnames);
title('Car Data')

Change the appearance of the scatter plot in the bottom left of the matrix by using h and ax. First, change the colors of the data points in the scatter plot. Then, add grid lines to the scatter plot.
bottomleftPlot = h(5,1,:);
bottomleftPlot(1).Color = 'magenta';
bottomleftPlot(2).Color = 'green';
bottomleftPlot(3).Color = 'black';

bottomleftAxes = ax(5,1);
bottomleftAxes.XGrid = 'on';
bottomleftAxes.YGrid = 'on';
Change Marker Colors
Change the marker colors from the default scheme to colors determined by the hsv function.
Load the cereal data set. Create a scatter plot matrix of different cereal measurements using the default color scheme. Group the cereals by manufacturer. Display the cereal variable names along the diagonal of the plot matrix.
load cereal
X = [Sugars Carbo Sodium];
xnames = {'Sugars','Carbohydrates','Sodium'};
gplotmatrix(X,[],Mfg,[],[],[],[],'variable',xnames);

Change the marker colors to colors determined by the hsv function.
numGroups = length(unique(Mfg));
clr = hsv(numGroups);
gplotmatrix(X,[],Mfg,clr,[],[],[],'variable',xnames);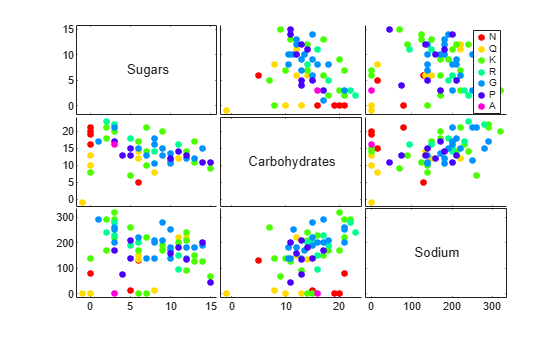
Input Arguments
X — Input data
numeric matrix | datetime array | duration array
Input data, specified as an n-by-p numeric
matrix, datetime array, or duration array. gplotmatrix creates a
matrix of plots using the columns of X. If you do not specify an
additional input matrix Y, then gplotmatrix
creates a p-by-p matrix of plots. The off-diagonal
plots are scatter plots, and the diagonal plots depend on the value of
dispopt. In each scatter plot, gplotmatrix
plots one column of X against another column of
X. The points in the scatter plots are grouped according to
group.
If you specify Y, then gplotmatrix creates
a q-by-p matrix of scatter plots using the
p columns of X and the q
columns of Y.
Data Types: single | double | datetime | duration
Y — Input data
numeric matrix | datetime array | duration array
Input data, specified as an n-by-q numeric
matrix, datetime array, or duration array. gplotmatrix creates a
q-by-p matrix of scatter plots using the
p columns of X and the q
columns of Y. For each column of the plot matrix, the
x-axis values of the scatter plots are the same as the values in
the corresponding column of X. Similarly, for each row of the plot
matrix, the y-axis values of the scatter plots are the same as the
values in the corresponding column of Y. The points in the scatter
plots are grouped according to group.
X and Y must have the same number of
rows.
Data Types: single | double | datetime | duration
group — Grouping variable
categorical vector | numeric vector | logical vector | character array | string array | cell array
Grouping variable, specified as a categorical vector, numeric vector, logical
vector, character array, string array, or cell array of character vectors.
Alternatively, group can be a cell array containing several
grouping variables (such as {g1 g2 g3}), in which case observations
are in the same group if they have common values of all grouping variables. In any case,
group must have the same number of rows as
X. Points in the same group appear on the graph with the same
marker color, symbol, and size.
Example: categorical({'blue','red','yellow','blue','yellow','red','red','yellow','blue','red'})
Example: {Smoker,Gender} where Smoker and
Gender are grouping variables
Data Types: categorical | single | double | logical | char | string | cell
clr — Marker colors
MATLAB® default colors (default) | character vector or string scalar of short color names | matrix of RGB triplets
Marker colors, specified as a character vector or string scalar of short color names or a matrix of RGB triplets.
For a custom color, specify a matrix of RGB triplets. An RGB triplet is a
three-element row vector whose elements specify the intensities of the red, green, and
blue components of the color. The intensities must be in the range
[0,1]; for example, [0.4 0.6 0.7].
Alternatively, you can specify some common colors by name. This table lists the named color options and the equivalent RGB triplets
| Short Name | RGB Triplet | Appearance |
|---|---|---|
'r' | [1 0 0] |
|
'g' | [0 1 0] |
|
'b' | [0 0 1] |
|
'c' | [0 1 1] |
|
'm' | [1 0 1] |
|
'y' | [1 1 0] |
|
'k' | [0 0 0] |
|
'w' | [1 1 1] |
|
This table lists the RGB triplet color codes for the default colors used by MATLAB in many types of plots.
| RGB Triplet | Appearance |
|---|---|
[0 0.4470 0.7410] |
|
[0.8500 0.3250 0.0980] |
|
[0.9290 0.6940 0.1250] |
|
[0.4940 0.1840 0.5560] |
|
[0.4660 0.6740 0.1880] |
|
[0.3010 0.7450 0.9330] |
|
[0.6350 0.0780 0.1840] |
|
The default value for clr is the matrix of RGB triplets
containing the MATLAB default colors.
If you do not specify enough colors for all unique groups in g,
then gplotmatrix cycles through the specified values in
clr. If you use default values when the number of unique groups
exceeds the number of default colors (7), then gplotmatrix cycles
through the default values, as needed.
Example: 'rgb'
Example: [0 0 1; 0 0 0]
Data Types: char | string | single | double
sym — Marker symbols
'.' (default) | character vector | string scalar
Marker symbols, specified as a character vector or string scalar.
You can choose among these marker options.
| Value | Description |
|---|---|
'o' | Circle |
'+' | Plus sign |
'*' | Asterisk |
'.' | Point |
'x' | Cross |
's' | Square |
'd' | Diamond |
'^' | Upward-pointing triangle |
'v' | Downward-pointing triangle |
'>' | Right-pointing triangle |
'<' | Left-pointing triangle |
'p' | Five-pointed star (pentagram) |
'h' | Six-pointed star (hexagram) |
'none' | No markers |
By default, gplotmatrix assigns '.' as the
marker symbol for each group. When the total number of groups exceeds the number of
specified symbols, gplotmatrix cycles through the specified
symbols.
Example: 'x'
Example: 'xo+'
Data Types: char | string
siz — Marker sizes
positive numeric vector
Marker sizes, specified as a positive numeric vector. The default value is
determined by the number of observations. When the total number of groups exceeds the
number of specified sizes, gplotmatrix cycles through the specified
sizes.
Example: [6 12]
Data Types: single | double
doleg — Option to include legend
'on' (default) | 'off'
Option to include a legend, specified as either 'on' or
'off'. By default, the legend is displayed in the figure.
dispopt — Display options for diagonal plots
'stairs' (default) | 'hist' | 'grpbars' | 'none' | 'variable'
Display options for the diagonal plots in the plot matrix, specified as
'stairs', 'hist','grpbars',
'none', or 'variable'. This table describes the
different display options.
| Value | Description |
|---|---|
'stairs' | Plot the outlines of grouped histograms. |
'hist' | Plot histograms. |
'grpbars' | Plot grouped histograms. |
'none' | Display blank plots. |
'variable' | Display variable names. To use this display option, you must specify
xnam. |
The default is 'stairs' when group contains
more than one group. Otherwise, gplotmatrix displays a single
histogram in each diagonal plot.
To generate the histograms, gplotmatrix uses the
'pdf' type of normalization for numeric data and the
'count' type of normalization for datetime and duration data. (See
the 'Normalization' name-value pair argument of histogram.) Note that the y-axis tick mark labels do not apply to the
histograms. Use data tips to see the correct histogram values.
xnam — X column names
character array | string array | cell array of character vectors
X column names, specified as a character array, string array,
or cell array of character vectors. xnam must contain one name for
each column of X.
Example: {'Sepal Length','Sepal Width','Petal Length','Petal
Width'}
Data Types: char | string | cell
ynam — Y column names
character array | string array | cell array of character vectors
Y column names, specified as a character array, string array,
or cell array of character vectors. ynam must contain one name for
each column of Y.
Example: {'Diastolic','Systolic'}
Data Types: char | string | cell
parent — Parent container
Figure object | Panel object
Parent container, specified as a Figure or
Panel object.
Output Arguments
Version History
Introduced before R2006aYou can also select a web site from the following list:
Americas
- América Latina (Español)
- Canada (English)
- United States (English)
Europe
- Belgium (English)
- Denmark (English)
- Deutschland (Deutsch)
- España (Español)
- Finland (English)
- France (Français)
- Ireland (English)
- Italia (Italiano)
- Luxembourg (English)
- Netherlands (English)
- Norway (English)
- Österreich (Deutsch)
- Portugal (English)
- Sweden (English)
- Switzerland
- United Kingdom (English)