ezplot
(Not recommended) Easy-to-use function plotter
ezplot is not recommended. Use fplot instead. For more information, see Version History.
Syntax
Description
ezplot( plots the curve defined by the
function f)y = f(x) over the default interval [-2π
2π] for x.
ezplot automatically adds a title and axis labels to the
plot.
ezplot( plots the curve defined by
the implicit function f2)0 = f2(x,y) over the default interval
[-2π
                    2π]
for x and
y.
ezplot(
plots over the specified interval. To use the same interval for both
f2,xyinterval)x and y, specify
xyinterval as a two-element vector of the form
[min max]. To use different intervals, specify a four-element
vector of the form [xmin xmax ymin ymax].
ezplot(___,fig) plots into the specified figure
window. Use any of the input argument combinations in the previous syntaxes that
include an interval.
ezplot( plots into
the axes specified by ax,___)ax instead of the current axes
gca. Specify the axes before any of the input argument
combinations in any of the previous syntaxes except for the ones that involve
fig. This syntax does not support the
fig input.
h = ezplot(___) returns either a chart line or
contour object. Use h to modify the chart line or contour after
it is created. For a list of properties, see Line Properties and Contour Properties.
Examples
Plot the explicit function over the domain .
ezplot('x^2')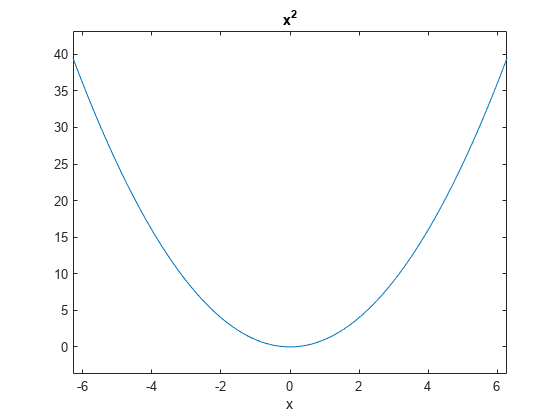
The default domain is .