imagesc
Display image with scaled colors
Syntax
Description
imagesc( displays the data in array
C)C as an image that uses the full range of colors in the
colormap. Each element of C specifies the color for one
pixel of the image. The resulting image is an
m-by-n grid of pixels where
m is the number of rows and n is the
number of columns in C. The row and column indices of the
elements determine the centers of the corresponding pixels.
imagesc( specifies
the image location. Use x,y,C)x and y to
specify the locations of the corners corresponding to C(1,1) and C(m,n).
To specify both corners, set x and y as
two-element vectors. To specify the first corner and let imagesc determine
the other, set x and y as scalar
values. The image is stretched and oriented as applicable.
imagesc('CData', adds the image to
the current axes without replacing existing plots. This syntax is the low-level
version of C)imagesc(C). For more information, see High-Level Versus Low-Level Version.
imagesc(___,
specifies image properties using one or more name-value pair arguments. You can
specify name-value pair arguments after any of the input argument combinations
in the previous syntaxes. For a list of image properties and descriptions, see
Image Properties.Name,Value)
imagesc(___,
specifies the data values that map to the first and last elements of the
colormap. Specify clims)clims as a two-element vector of the form
[cmin cmax], where values less than or equal to
cmin map to the first color in the colormap and values
greater than or equal to cmax map to the last color in the
colormap. Specify clims after name-value pair
arguments.
imagesc( creates the image in the
axes specified by ax,___)ax instead of in the current axes
(gca). Specify the axes as the first input
argument.
Examples
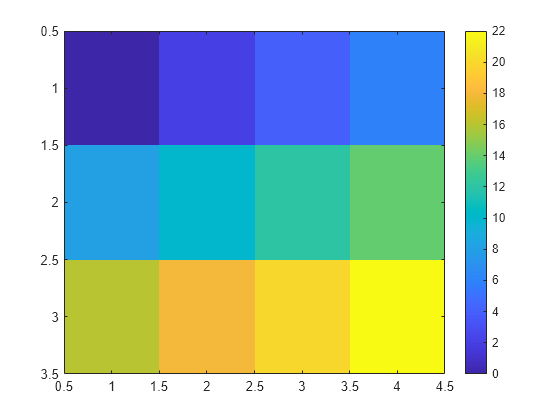
Create matrix C. Display an image of the data in C. Add a colorbar to the graph to show the current colormap. By default, imagesc scales the color limits so that image uses the full range of the colormap, where the smallest value in C maps to the first color in the colormap and the largest value maps to the last color.
C = [0 2 4 6; 8 10 12 14; 16 18 20 22];
imagesc(C)
colorbar
Place the image so that it lies between 5 and 8 on the x-axis and between 3 and 6 on the y-axis.
x = [5 8];
y = [3 6];
C = [0 2 4 6; 8 10 12 14; 16 18 20 22];
imagesc(x,y,C)
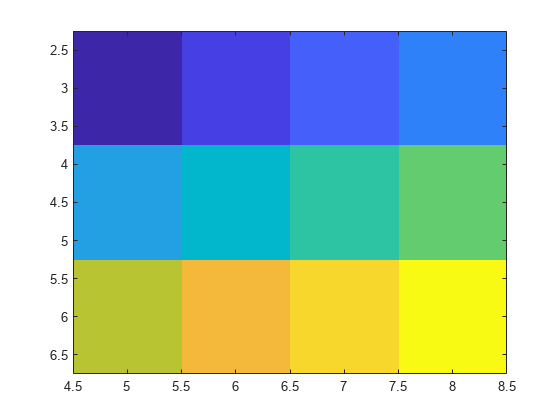
Notice that the pixel corresponding to C(1,1) is centered over the point (5,3). The pixel corresponding to C(3,4) is centered over the point (8,6). imagesc positions and orients the rest of the image between those two points.
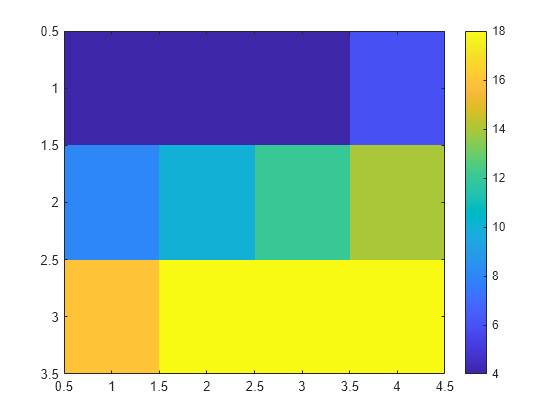
Create C as an array of data values. Create an image of C and set the color limits so that values of 4 or less map to the first color in the colormap and values of 18 or more map to the last color in the colormap. Display a colorbar to show how the data values map into the colormap.
C = [0 2 4 6; 8 10 12 14; 16 18 20 22];
clims = [4 18];
imagesc(C,clims)
colorbar
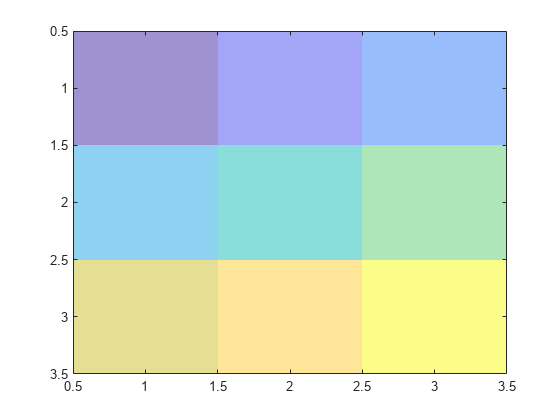
Create an image and return the image object, im. Then, make the image semitransparent by setting the AlphaData property of the image object.
C = [1 2 3; 4 5 6; 7 8 9];
im = imagesc(C);
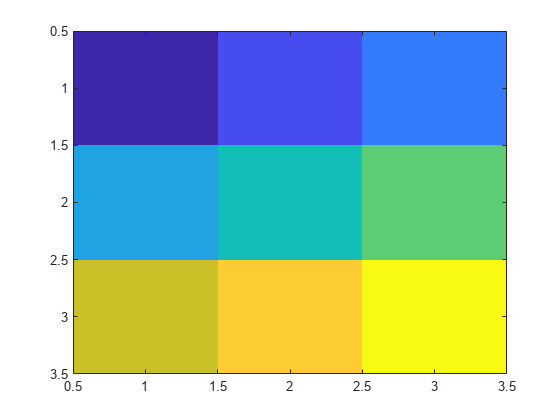
im.AlphaData = .5;
Create a surface plot. Then, add an image under the surface. imagesc displays the image in the xy-plane.
Z = 10 + peaks;
surf(Z)
hold on
imagesc(Z)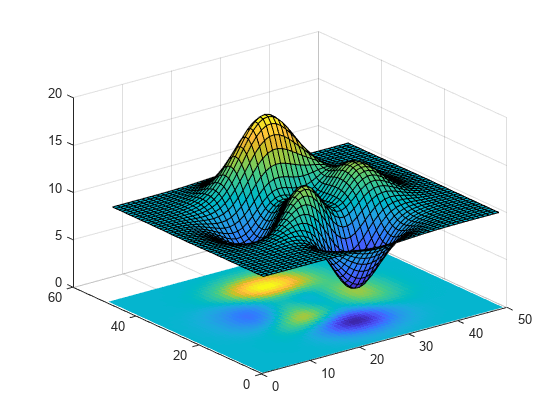
Input Arguments
Name-Value Arguments
Output Arguments
More About
Tips
To read image data into MATLAB from graphics files in various standard formats, such as TIFF, use
imread. To write MATLAB image data to graphics files, useimwrite. Theimreadandimwritefunctions support various graphics file formats and compression schemes.To view or set the color limits of the axes, you can use the
climfunction.Before R2022a: Use
caxis, which has the same syntaxes and arguments asclim.