polar
(Not recommended) Polar coordinate plot
polar is not recommended. Use polarplot instead. For information on updating your code, see Version History.
Description
ln = polar(___) returns the Line
object used to create the polar plot. Use ln to modify the polar plot
after it is created. For a list of properties, see Line Properties.
Examples
Create a polar plot using a dashed red line.
theta = 0:0.01:2*pi;
rho = sin(2*theta).*cos(2*theta);
polar(theta,rho,"--r")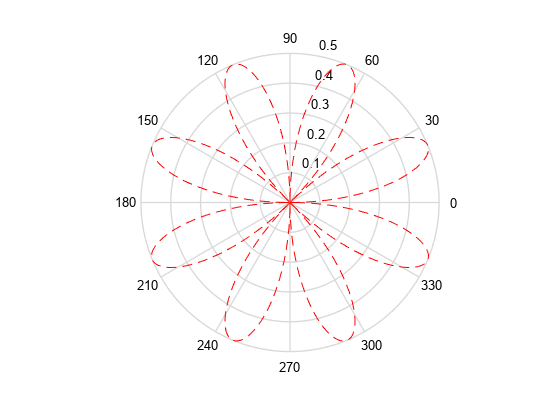
Input Arguments
Angle values, specified as a vector or matrix. Specify the values in radians.
Radius values, specified as a vector or matrix.
Negative rho values reflect through the origin, rotating by
pi (since (theta,rho) transforms to
(rho*cos(theta),rho*sin(theta))). If you want different behavior,
you can manipulate rho prior to plotting. For example, you can set
rho equal to max(0,rho) or
abs(rho).
Line style, marker, and color, specified as a string scalar or character vector containing symbols. The symbols can appear in any order. You do not need to specify all three characteristics (line style, marker, and color). For example, if you omit the line style and specify the marker, then the plot shows only the marker and no line.
Example: "--or" is a red dashed line with circle markers.
| Line Style | Description | Resulting Line |
|---|---|---|
"-" | Solid line |
|
"--" | Dashed line |
|
":" | Dotted line |
|
"-." | Dash-dotted line |
|
| Marker | Description | Resulting Marker |
|---|---|---|
"o" | Circle |
|
"+" | Plus sign |
|
"*" | Asterisk |
|
"." | Point |
|
"x" | Cross |
|
"_" | Horizontal line |
|
"|" | Vertical line |
|
"square" | Square |
|
"diamond" | Diamond |
|
"^" | Upward-pointing triangle |
|
"v" | Downward-pointing triangle |
|
">" | Right-pointing triangle |
|
"<" | Left-pointing triangle |
|
"pentagram" | Pentagram |
|
"hexagram" | Hexagram |
|
| Color Name | Short Name | RGB Triplet | Appearance |
|---|---|---|---|
"red" | "r" | [1 0 0] |
|
"green" | "g" | [0 1 0] |
|
"blue" | "b" | [0 0 1] |
|
"cyan"
| "c" | [0 1 1] |
|
"magenta" | "m" | [1 0 1] |
|
"yellow" | "y" | [1 1 0] |
|
"black" | "k" | [0 0 0] |
|
"white" | "w" | [1 1 1] |
|
Target axes, specified as an Axes object. If you do not specify
the axes, MATLAB® plots into the current axes or it creates an Axes
object if one does not exist. polar does not support plotting into
PolarAxes objects.