idealfilter
timeseries ideal filter
Syntax
Description
tsout = idealfilter(
applies an ideal (noncausal) filter of type tsin,interval,filtertype)filtertype to the
frequency intervals specified by interval for a
timeseries object tsin.
Ideal filters are noncausal, and the ends of the filter amplitude
are flat in the frequency domain. The data in ts must have zero
mean.
tsout = idealfilter(
optionally specifies the row or column indices of tsin,interval,filtertype,ind)tsin to apply
the filter to.
Examples
First apply an ideal notch filter to a timeseries object, then apply a pass filter.
Load the data in the file count.dat, and create a timeseries object from the matrix count.
load count.dat
tsin = timeseries(count(:,1),1:24);
Compute the mean of the data in tsin.
tsinmean = mean(tsin);
Define the frequency interval, in hertz, for filtering the data.
interval = [0.08 0.2];
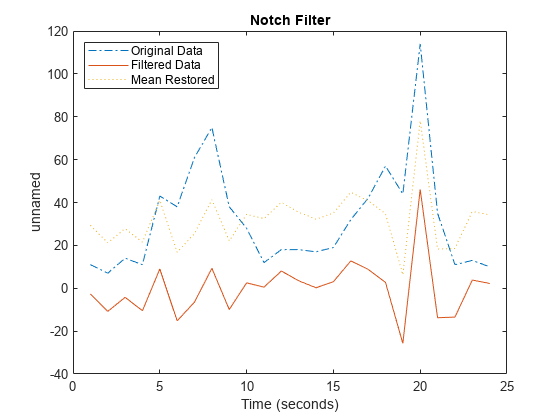
Invoke an ideal notch filter.
tsoutnotch = idealfilter(tsin,interval,'notch');Compare the original data and the filtered data.
plot(tsin,'-.')
hold on
plot(tsoutnotch,'-')
Restore the mean to the filtered data.
tsoutnotchmean = tsoutnotch + tsinmean;
plot(tsoutnotchmean,':')
title('Notch Filter')
legend('Original Data','Filtered Data','Mean Restored',...
       'Location','NorthWest')
hold off
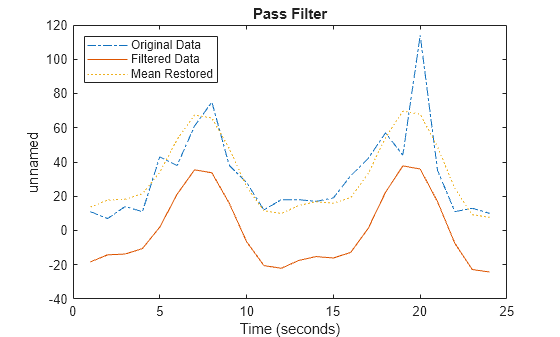
Repeat the filtering process using a pass filter.
plot(tsin,'-.')
hold on
tsoutpass = idealfilter(tsin,interval,'pass');
plot(tsoutpass,'-')

tsoutpassmean = tsoutpass + tsinmean;
plot(tsoutpassmean,':')
title('Pass Filter')
legend('Original Data','Filtered Data','Mean Restored',...
       'Location','NorthWest')
Input Arguments
Version History
Introduced before R2006a