title
Add title
Syntax
Description
title( adds the specified
title to the current axes or standalone visualization. Reissuing the
titletext)title command causes the new title to replace the old
title.
title(
adds a subtitle underneath the title.titletext,subtitletext)
title(___,
modifies the title appearance using one or more name-value pair arguments. For
example, Name,Value)'FontSize',12 sets the font size to 12 points. Specify
name-value pair arguments after all other input arguments. Modifying the title
appearance is not supported for all types of charts.
t = title(___)t to make future modifications to
the title.
Examples
Create a figure and display a title in the current axes.
plot((1:10).^2)
title('My Title')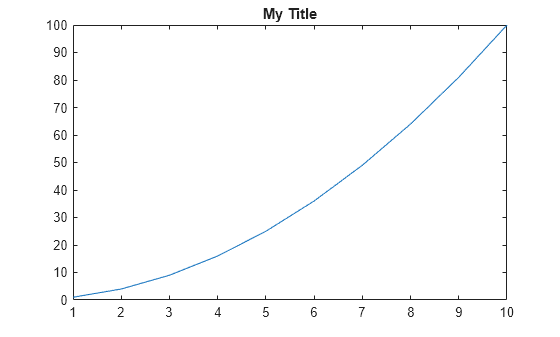
You also can call title with a function that returns text. For example, the date function returns text with today's date.
title(date)

MATLAB® sets the output of date as the axes title.
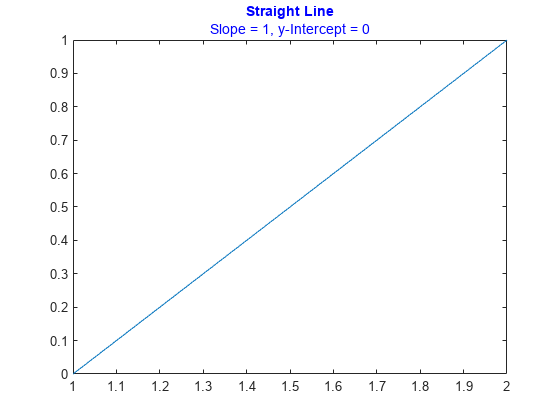
Create a plot. Then create a title and a subtitle by calling the title function with two character vectors as arguments. Use the 'Color' name-value pair argument to customize the color for both lines of text. Specify two return arguments to store the text objects for the title and subtitle.
plot([0 1])
[t,s] = title('Straight Line','Slope = 1, y-Intercept = 0',...
    'Color','blue');
Change the font size for the title to 16, and change the font angle for the subtitle to 'italic'.
t.FontSize = 16;
s.FontAngle = 'italic';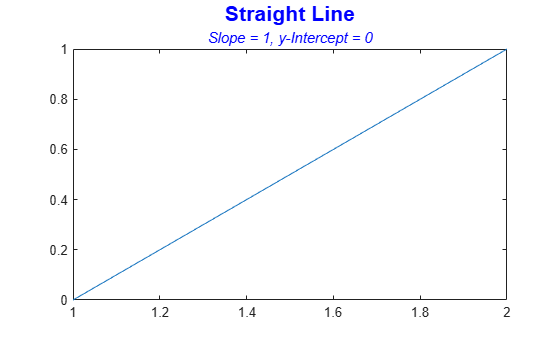
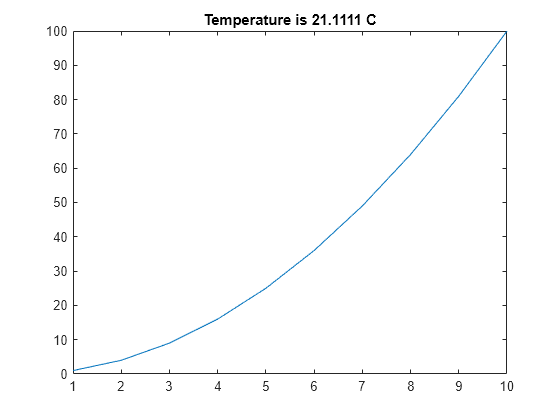
Include the value of variable c in a title.
figure
plot((1:10).^2)
f = 70;
c = (f-32)/1.8;
title(['Temperature is ',num2str(c),' C'])
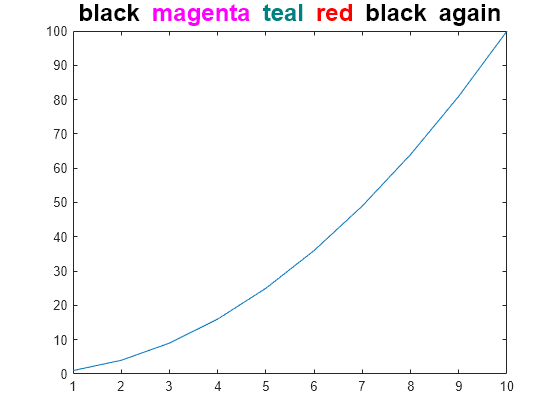
Use the color modifier \color to change the color of characters following it from the previous color.
plot((1:10).^2)
title(['\fontsize{16}black {\color{magenta}magenta '...
'\color[rgb]{0 .5 .5}teal \color{red}red} black again'])
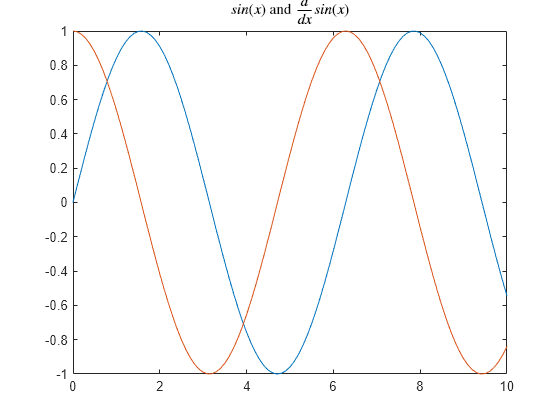
Create a plot, and define t as a character vector that includes LaTeX markup. Surround the markup with dollar signs ($). Then pass t to the title function, and set the Interpreter property to 'latex'.
x = 0:0.1:10;
y = sin(x);
dy = cos(x);
plot(x,y,x,dy);
t = '$sin(x)$ and $\frac{d}{dx}sin(x)$';
title(t,'interpreter','latex')
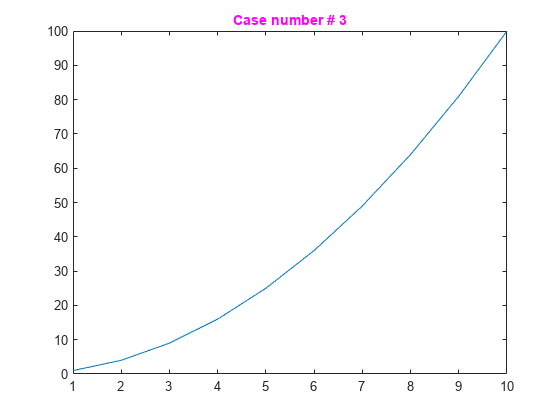
Use the Name,Value pair 'Color','m' to set the color of the title to magenta.
figure
plot((1:10).^2)
title('Case number # 3','Color', 'm')
Use TeX markup to include Greek symbols in a title.
t = (0:0.01:0.2);
y = exp(-25*t);
figure
plot(t,y)
title('y = \ite^{\lambda t}','Color','b')
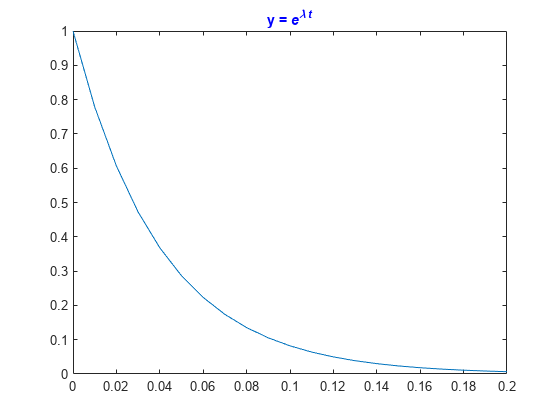
The 'Interpreter' property must be 'tex' (the default).
figure
plot((1:10).^2)
title('\alpha^2 and X_1')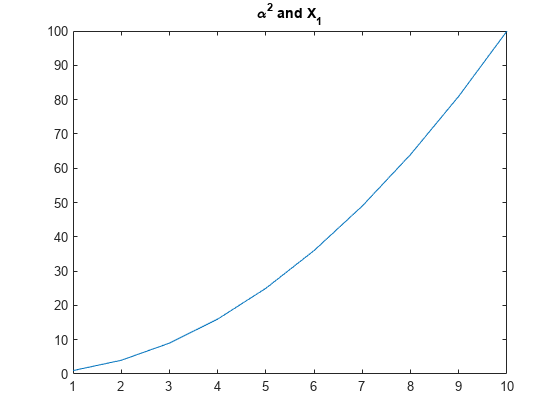
The superscript character, "^", and the subscript character, "_", modify the character or substring defined in braces immediately following.
Create a multiline title using a multiline cell array.
figure
plot((1:10).^2)
title({'First line';'Second line'})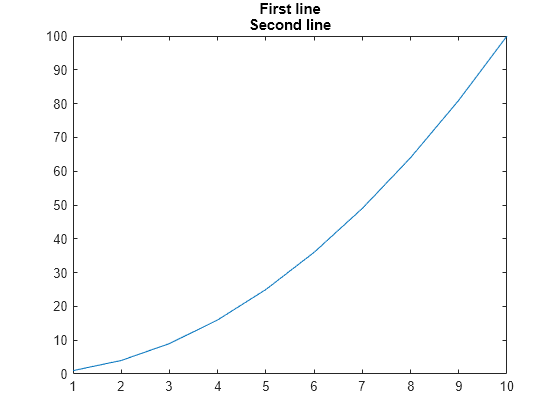
Set the Interpreter property as 'none' so that the text X_1 is displayed in the figure as typed, without making 1 a subscript of X.
plot((1:10).^2)
title('X_1','Interpreter','none')

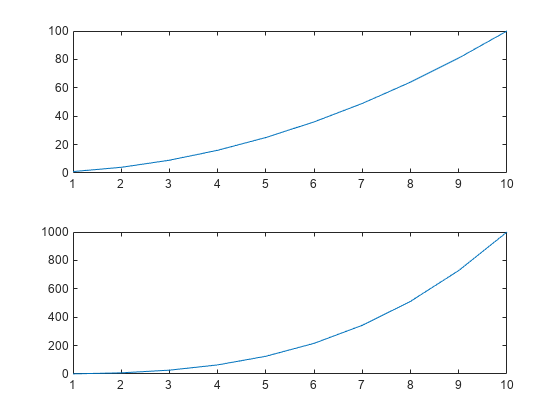
Starting in R2019b, you can display a tiling of plots using the tiledlayout and nexttile functions. Call the tiledlayout function to create a 2-by-1 tiled chart layout. Call the nexttile function to create the axes objects ax1 and ax2. Then plot data into each axes.
tiledlayout(2,1)
ax1 = nexttile;
plot(ax1,(1:10).^2)
ax2 = nexttile;
plot(ax2,(1:10).^3)
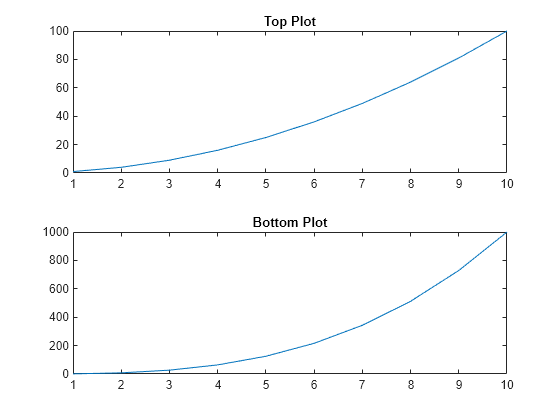
Add a title to each axes by passing ax1 and ax2 to the title function.
title(ax1,'Top Plot')
title(ax2,'Bottom Plot')
Add a title to a plot and return the text object.
plot((1:10).^2)
t = title('My Title');
Set the color of the title to red. Use dot notation to set properties.
t.Color = 'red';
Create a plot with a title. Get the current axes, and then align the title to the left edge of the plot box by setting the TitleHorizontalAlignment property of the axes to 'left'.
plot([0 2],[1 5])
title('Straight Line')
ax = gca;
ax.TitleHorizontalAlignment = 'left';

Center the title setting the TitleHorizontalAlignment property on the axes to 'center'.
ax.TitleHorizontalAlignment = 'center';
Input Arguments
Name-Value Arguments
Specify optional pairs of arguments as
Name1=Value1,...,NameN=ValueN, where Name is
the argument name and Value is the corresponding value.
Name-value arguments must appear after other arguments, but the order of the
pairs does not matter.
Before R2021a, use commas to separate each name and value, and enclose
Name in quotes.
Example: 'Color','red','FontSize',14 adds
a title with red, 14-point font.
In addition to the following, you can specify other text object
properties using Name,Value pair arguments. See Text Properties.
Font size, specified as a scalar value greater than 0 in point units. One point equals 1/72 inch. To change the font units, use the FontUnits property.
If you add a title or subtitle to an axes object, then the font size property for the axes
also affects the font size for the title and subtitle. The title and subtitle font sizes
are the axes font size multiplied by a scale factor. The FontSize property of the axes
contains the axes font size. The TitleFontSizeMultiplier property of the axes contains the scale factor.
By default, the axes font size is 10 points and the scale factor is 1.1, so the title
and subtitle each have a font size of 11 points.
Data Types: single | double | int8 | int16 | int32 | int64 | uint8 | uint16 | uint32 | uint64
Thickness of the text characters, specified as one of these values:
'normal'— Normal weight as defined by the particular font'bold'— Thicker characters outlines than normal
MATLAB uses the FontWeight property
to select a font from those available on your system. Not all fonts
have a bold font weight. Therefore, specifying a bold font weight
could still result in the normal font weight.
The TitleFontWeight property for the associated axes affects
the FontWeight value for the title. Similarly, the
SubtitleFontWeight property for the associated axes
affects the FontWeight value for the subtitle.
Note
The 'light' and 'demi' font
weight values have been removed. Use 'normal' instead.
Alternatively, you can specify some common colors by name. This table lists the named color options, the equivalent RGB triplets, and the hexadecimal color codes.
| Color Name | Short Name | RGB Triplet | Hexadecimal Color Code | Appearance |
|---|---|---|---|---|
"red" | "r" | [1 0 0] | "#FF0000" |
|
"green" | "g" | [0 1 0] | "#00FF00" |
|
"blue" | "b" | [0 0 1] | "#0000FF" |
|
"cyan"
| "c" | [0 1 1] | "#00FFFF" |
|
"magenta" | "m" | [1 0 1] | "#FF00FF" |
|
"yellow" | "y" | [1 1 0] | "#FFFF00" |
|
"black" | "k" | [0 0 0] | "#000000" |
|
"white" | "w" | [1 1 1] | "#FFFFFF" |
|
"none" | Not applicable | Not applicable | Not applicable | No color |
This table lists the default color palettes for plots in the light and dark themes.
| Palette | Palette Colors |
|---|---|
Before R2025a: Most plots use these colors by default. |
|
|
|
You can get the RGB triplets and hexadecimal color codes for these palettes using the orderedcolors and rgb2hex functions. For example, get the RGB triplets for the "gem" palette and convert them to hexadecimal color codes.
RGB = orderedcolors("gem");
H = rgb2hex(RGB);
Before R2023b: Get the RGB triplets using RGB =
get(groot,"FactoryAxesColorOrder").
Before R2024a: Get the hexadecimal color codes using H =
compose("#%02X%02X%02X",round(RGB*255)).
Example: 'blue'
Example: [0
0 1]
Example: '#0000FF'
LaTeX Markup
To use LaTeX markup, set the interpreter to "latex". For inline
mode, surround the markup with single dollar signs ($). For
display mode, surround the markup with double dollar signs
($$).
| LaTeX Mode | Example | Result |
|---|---|---|
| Inline |
"$\int_1^{20} x^2 dx$" |
|
| Display |
"$$\int_1^{20} x^2 dx$$" |
|


The displayed text uses the default LaTeX font style. The
FontName, FontWeight, and
FontAngle properties do not have an effect. To change the
font style, use LaTeX markup.
The maximum size of the text that you can use with the LaTeX interpreter is 1200 characters. For multiline text, this reduces by about 10 characters per line.
MATLAB supports most standard LaTeX math mode commands. For more information, see Supported LaTeX Commands. For examples that use TeX and LaTeX, see Greek Letters and Special Characters in Chart Text.
Output Arguments
Tips
By default, the
Interactionsproperty containseditInteractionso the text can be edited by clicking on the text. To disable this interaction, set theInteractionsproperty of the text object to[].
Version History
Introduced before R2006a