trisurf
Triangular surface plot
Description
trisurf(___, also specifies the
surface color for either of the previous syntaxes.c)
trisurf(___, specifies
one or more properties of the surface plot using name-value pairs. For example,
Name,Value)'FaceColor','y' sets the face color to yellow.
h = trisurf(___) returns a patch object used to create the surface plot. Use h to
query and modify properties of the plot. For more information, see Patch Properties.
Examples
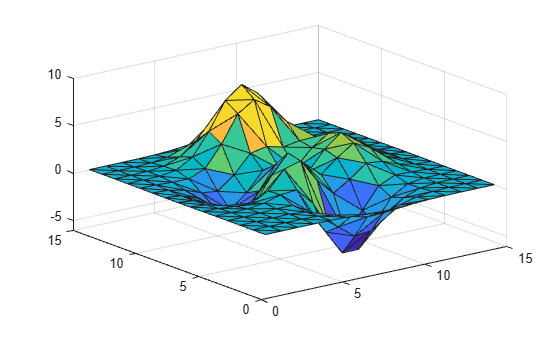
Create a set of 3-D points and compute the Delaunay triangulation using the delaunay function. Plot the surface defined by the triangulation.
[x,y] = meshgrid(1:15,1:15);
z = peaks(15);
T = delaunay(x,y);
trisurf(T,x,y,z)

Alternatively, you can create and plot a triangulation object.
TO = triangulation(T,x(:),y(:),z(:));
trisurf(TO)
Input Arguments
Name-Value Arguments
Specify optional pairs of arguments as
Name1=Value1,...,NameN=ValueN, where Name is
the argument name and Value is the corresponding value.
Name-value arguments must appear after other arguments, but the order of the
pairs does not matter.
Before R2021a, use commas to separate each name and value, and enclose
Name in quotes.
Example: trisurf(TO,'FaceColor','r')
The properties listed here are only a subset. For a complete list, see Patch Properties.
Face color, specified as the comma-separated pair consisting of
'FaceColor' and a color name, an RGB triplet, or
'none'.
An RGB triplet is a three-element row vector whose elements specify the intensities
of the red, green, and blue components of the color. The intensities must be in the
range [0,1]; for example, [0.4 0.6 0.7]. This
table lists the long and short color name options and the equivalent RGB triplet
values.
| Long Name | Short Name | RGB Triplet |
|---|---|---|
'yellow' | 'y' | [1 1 0] |
'magenta' | 'm' | [1 0 1] |
'cyan' | 'c' | [0 1 1] |
'red' | 'r' | [1 0 0] |
'green' | 'g' | [0 1 0] |
'blue' | 'b' | [0 0 1] |
'white' | 'w' | [1 1 1] |
'black' | 'k' | [0 0 0] |
Face transparency, specified as the comma-separated pair consisting of
'FaceAlpha' and a scalar in the range [0,1]. A
value of 1 is opaque and 0 is completely transparent. Values between 0 and 1 are
semitransparent.
Edge color, specified as the comma-separated pair consisting of
'EdgeColor' and a color name, an RGB triplet, or
'none'. The default color of [0 0 0]
corresponds to black boundaries.
An RGB triplet is a three-element row vector whose elements specify the
intensities of the red, green, and blue components of the color. The intensities must
be in the range [0,1]; for example, [0.4 0.6
0.7]. This table lists the long and short color name options and the
equivalent RGB triplet values.
| Long Name | Short Name | RGB Triplet |
|---|---|---|
'yellow' | 'y' | [1 1 0] |
'magenta' | 'm' | [1 0 1] |
'cyan' | 'c' | [0 1 1] |
'red' | 'r' | [1 0 0] |
'green' | 'g' | [0 1 0] |
'blue' | 'b' | [0 0 1] |
'white' | 'w' | [1 1 1] |
'black' | 'k' | [0 0 0] |
Line width, specified as the comma-separated pair consisting of
'LineWidth' and a positive numeric value in points.
Line style, specified as one of the options listed in this table.
| Line Style | Description | Resulting Line |
|---|---|---|
"-" | Solid line |
|
"--" | Dashed line |
|
":" | Dotted line |
|
"-." | Dash-dotted line |
|
"none" | No line | No line |
Extended Capabilities
Version History
Introduced before R2006a
See Also
patch | surf | tetramesh | trimesh | triplot | delaunay | triangulation | delaunayTriangulation