ylim
Set or query y-axis limits
Syntax
Description
Specify Limits
ylim( sets the y-axis
limits for the current axes or chart. Specify limits)limits as a
two-element vector of the form [ymin ymax], where
ymax is greater than ymin.
ylim( specifies the
limit method MATLAB® uses for automatic limit selection. Specify the limit method as
limitmethod)"tickaligned", "tight", or
"padded". MATLAB sets the YLimitMethod property of the axes to
the value you specify. The limit method is not supported for standalone
visualizations.
You can specify the limitmethod argument without
parentheses. For example, ylim tight enables tight
y-axis limits.
ylim( specifies automatic
or manual limit selection. The limitmode)limitmode can have either of
two values:
"auto"— Enable automatic limit selection. MATLAB selects the limits based on the range of your data and the value of theYLimitMethodproperty of the axes. If you plot into the axes multiple times, the limits update to encompass all the data."manual"— Freeze the y-axis limits at their current value.
You can specify the limitmode argument without
parentheses. For example, ylim auto enables automatic limit
selection.
Query Limits
limmethod = ylim("method")'tickaligned', 'tight', or
'padded'.
limmode = ylim("mode")'auto' or 'manual'. By default, the
mode is automatic unless you specify limits or set the mode to manual.
Specify Target Axes or Chart
___ = ylim(
uses the axes or standalone visualization specified by
target,___)target instead of the current axes. Specify
target as the first input argument for any of the
previous syntaxes. You can include an output argument if the original syntax
supports an output argument. Use quotes around the mode inputs, for example,
ylim(target,"auto").
Examples
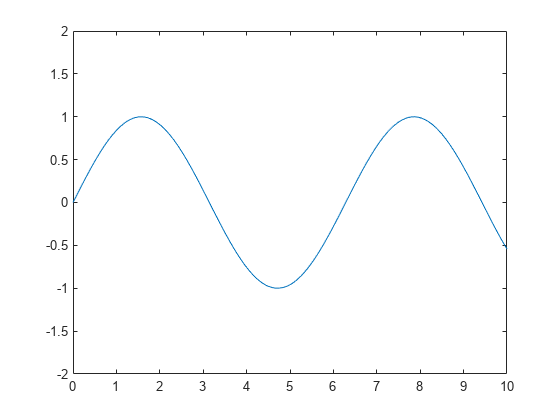
Plot a line and set the y-axis limits to range from -2 to 2.
x = linspace(0,10);
y = sin(x);
plot(x,y)
ylim([-2 2])
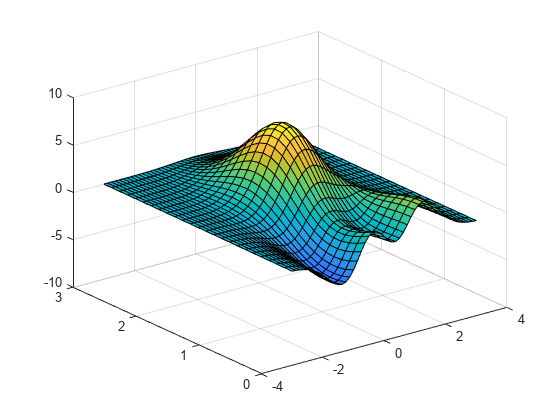
Create a surface plot and show only y values greater than 0. Specify the minimum y-axis limit as 0 and let MATLAB choose the maximum limit.
[X,Y,Z] = peaks;
surf(X,Y,Z)
ylim([0 inf])
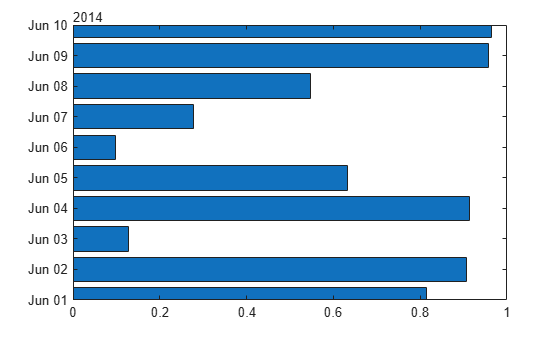
Create a horizontal bar chart with dates along the y-axis. Set the y-axis limits to range from June 1, 2014 to June 10, 2014.
t = datetime(2014,06,1) + caldays(0:20);
y = rand(21,1);
barh(t,y)

tstart = datetime(2014,06,1);
tend = datetime(2014,06,10);
ylim([tstart tend])
Create a line plot.
x = 1:5;
y = [-2.7 2 -1 4.2 0];
plot(x,y)
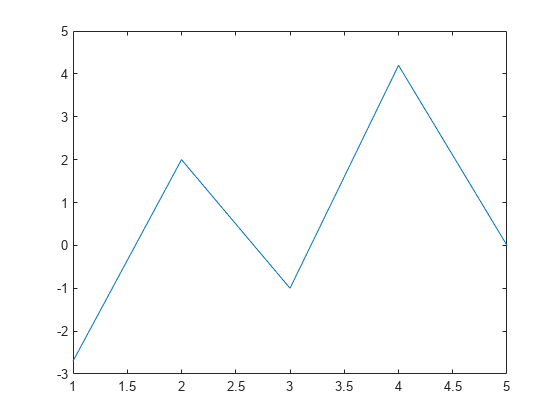
Change the limit method to 'tight'.
ylim tight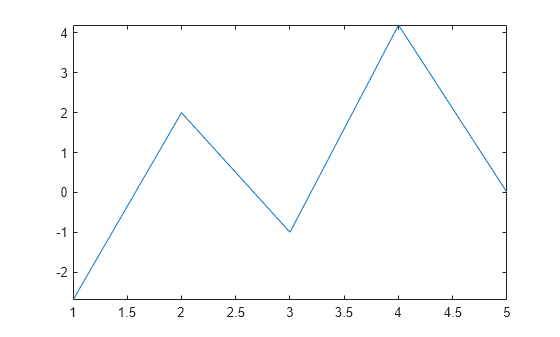
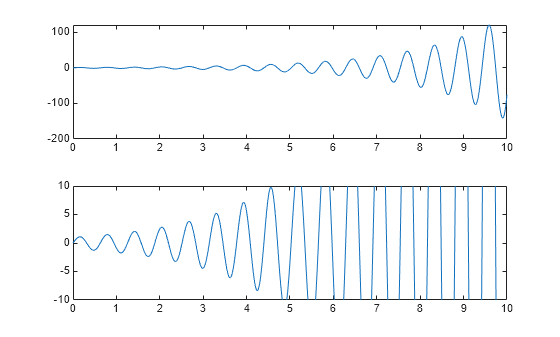
Starting in R2019b, you can display a tiling of plots using the tiledlayout and nexttile functions. Call the tiledlayout function to create a 2-by-1 tiled chart layout. Call the nexttile function to create the axes objects ax1 and ax2. Plot data into each axes. Then set the y-axis limits for the bottom plot by specifying ax2 as the first input argument to ylim.
tiledlayout(2,1)
x = linspace(0,10,1000);
y = sin(10*x).*exp(.5*x);
ax1 = nexttile;
plot(ax1,x,y)

ax2 = nexttile;
plot(ax2,x,y)
ylim(ax2,[-10 10])
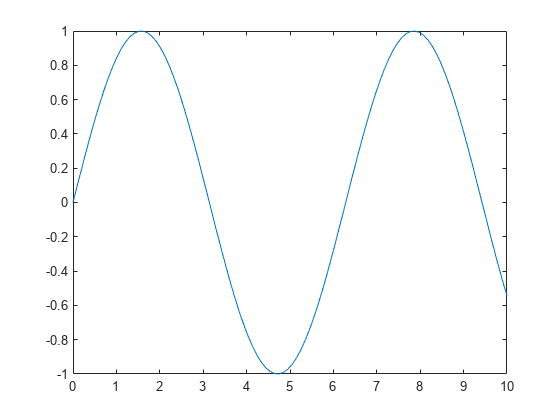
Use manual mode to maintain the current y-axis limits when you add more plots to the axes.
First, plot a line.
x = linspace(0,10);
y = sin(x);
plot(x,y)
Set the y-axis limits mode to manual so that the limits to not change. Use hold on to add a second plot to the axes.
ylim manual
hold on
y2 = 2*sin(x);
plot(x,y2)
hold off
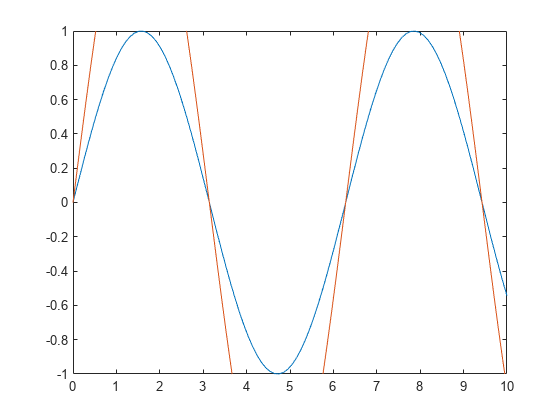
The y-axis limits do not update to incorporate the new plot.
Switch back to automatically updated limits by resetting the mode to automatic.
ylim auto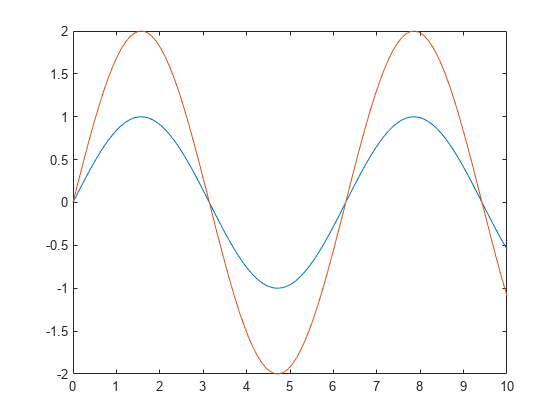
Create a scatter plot of random data. Return the values of the y-axis limits.
x = randn(50,1);
y = randn(50,1);
scatter(x,y)
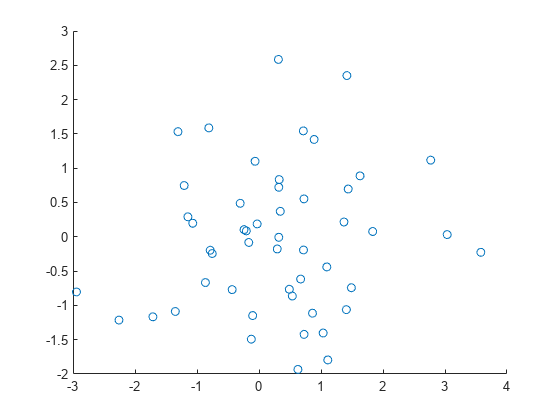
yl = ylim
yl = 1×2

    -2     3
Input Arguments
Minimum and maximum limits, specified as a two-element vector
of the form [ymin ymax], where ymax is
greater than ymin. You can specify the limits as
numeric, categorical, datetime, or duration values. However, the type
of values that you specify must match the type of values along the y-axis.
You can specify both limits, or specify one limit and let MATLAB automatically calculate the other. For an automatically
calculated minimum or maximum limit, use -inf or
inf, respectively. MATLAB uses the 'tight' limit method to calculate
the corresponding limit.
Example: ylim([0 1])
Example: ylim([-inf 1])
Example: ylim([0 inf])
Data Types: single | double | int8 | int16 | int32 | int64 | uint8 | uint16 | uint32 | uint64 | categorical | datetime | duration
Limit selection method, specified as a value from the table.
The examples in the table show the approximate appearance for each method. Your results might differ depending on your data, the size of the axes, and the type of plot you create.
| Value | Description | Example |
|---|---|---|
"tickaligned" | In general, align the edges of the axes box with the tick marks that are closest to your data without excluding any data. The appearance might vary depending on the type of data you plot and the type of chart you create. |
|
"tight" | Fit the axes box tightly around the data by setting the axis limits to the data range. |
|
"padded" | Fit the axes box around the data with a thin margin of padding on each side. The width of the margin is approximately 7% of the data range. |
|


Note
The limit method has no effect when the
YLimModeproperty of the axes is set to"manual".Specifying the limit method is not supported for standalone visualizations such as
heatmap.
Limit mode, specified as one of the following values:
"auto"— Enable automatic limit selection, which is based on the total span of the data and the value of theYLimitMethodproperty of the axes. If you plot into the axes multiple times, the limits update to encompass all the data. You can use this option if you change the limits and want to set them back to the default values."manual"— Freeze the limits at the current values. Use this option if you want to retain the current limits when adding new data to the axes using thehold oncommand.
When you specify this argument, MATLAB sets the YLimMode property of the axes to
the value you specify. However, the YLimMode property
changes to "manual" whenever you set the
y-axis limits explicitly, either by calling
ylim(limits), or by setting the value of the
YLim property on the axes.
Target axes or chart, specified as one of the following:
If you do not specify this argument, then ylim sets the
limits on the graphics object returned by the gca
command.
Output Arguments
Algorithms
The ylim function sets and queries several
axes properties related to the y-axis limits.
YLim— Property that stores the y-axis limits.YLimMode— Property that stores the y-axis limits mode. When you set the y-axis limits, this property changes to"manual".YLimitMethod— Property that controls how the y-axis limits are calculated when theYLimModeproperty is set to"auto".