HeatMap
Object containing matrix and heatmap display properties
Description
The HeatMap function creates a HeatMap
object. You can use the object to display a heatmap (2-D color image) of matrix
data.
Creation
Description
hmObj = HeatMap(
displays a heatmap (2-D color image) of data)data and returns an object
containing the data and display properties.
hmObj =
HeatMap(
sets the object properties using
name-value pairs. For example, data,Name,Value)HeatMap(data,'Annotate',true) displays
data values in the heatmap. You can specify multiple name-value pairs. Enclose each
property name in quotes.
Input Arguments
Name-Value Arguments
Properties
Object Functions
Examples
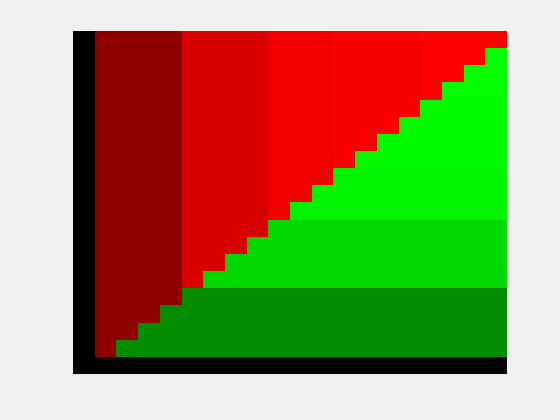
Create a matrix of data.
data = gallery('invhess',20);Display a 2-D color heatmap of the data.
hmo = HeatMap(data);
             Standardize: '[column | row | {none}]'
               Symmetric: '[true | false].'
            DisplayRange: 'Scalar.'
                Colormap: []
               ImputeFun: 'string -or- function handle -or- cell array'
            ColumnLabels: 'Cell array of strings, or an empty cell array'
               RowLabels: 'Cell array of strings, or an empty cell array'
      ColumnLabelsRotate: []
         RowLabelsRotate: []
                Annotate: '[on | {off}]'
          AnnotPrecision: []
              AnnotColor: []
       ColumnLabelsColor: 'A structure array.'
          RowLabelsColor: 'A structure array.'
       LabelsWithMarkers: '[true | false].'
    ColumnLabelsLocation: '[ top | {bottom} ]'
       RowLabelsLocation: '[ {left} | right ]'
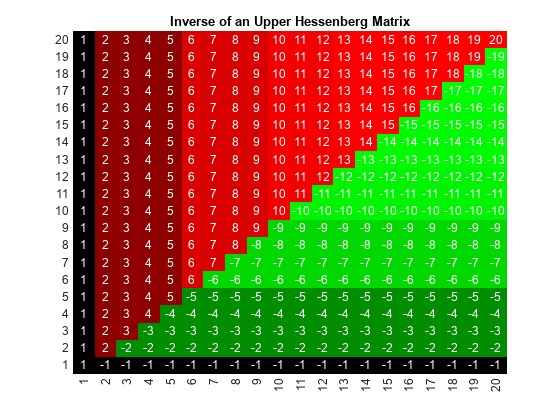
Display the data values in the heatmap.
hmo.Annotate = true;
view(hmo)

Use the plot function to display the heatmap in another figure specified by the figure handle fH.
fH = figure;
hA = plot(hmo,fH);

Use the returned axes handle hA to specify the axes properties.
hA.Title.String = 'Inverse of an Upper Hessenberg Matrix';
hA.XTickLabelMode = 'auto';
hA.YTickLabelMode = 'auto';
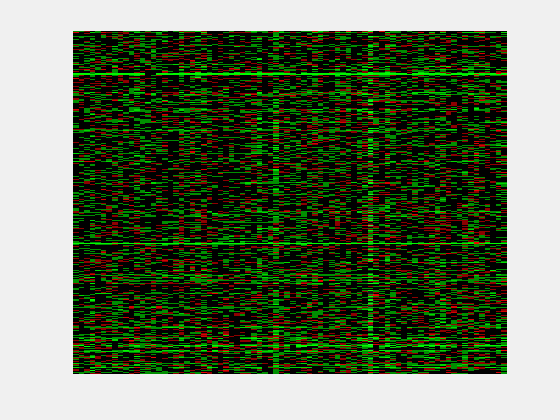
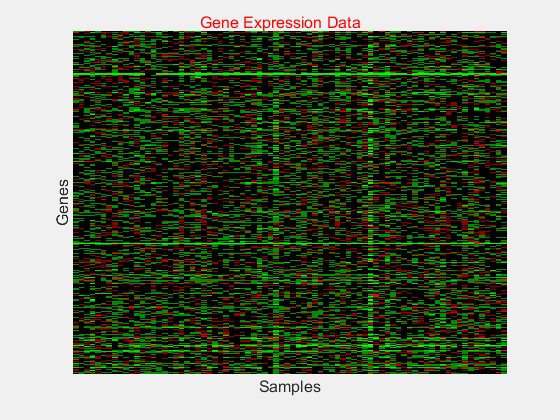
Load a sample of gene expression data.
load bc_train_filteredDisplay a heatmap of the gene expression values for 4918 genes from 78 samples.
hmo = HeatMap(bcTrainData.Log10Ratio);
             Standardize: '[column | row | {none}]'
               Symmetric: '[true | false].'
            DisplayRange: 'Scalar.'
                Colormap: []
               ImputeFun: 'string -or- function handle -or- cell array'
            ColumnLabels: 'Cell array of strings, or an empty cell array'
               RowLabels: 'Cell array of strings, or an empty cell array'
      ColumnLabelsRotate: []
         RowLabelsRotate: []
                Annotate: '[on | {off}]'
          AnnotPrecision: []
              AnnotColor: []
       ColumnLabelsColor: 'A structure array.'
          RowLabelsColor: 'A structure array.'
       LabelsWithMarkers: '[true | false].'
    ColumnLabelsLocation: '[ top | {bottom} ]'
       RowLabelsLocation: '[ {left} | right ]'
Add a title to the heatmap in red.
title = addTitle(hmo,'Gene Expression Data','Color','red');
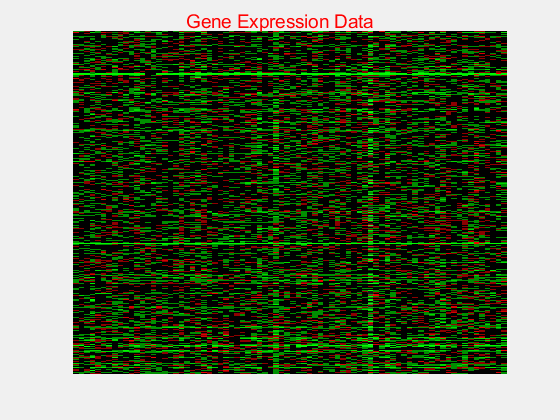
Change the title font size.
title.FontSize = 12;

Add labels to the x-axis and y-axis.
addXLabel(hmo,'Samples','FontSize',12);
addYLabel(hmo,'Genes','FontSize',12);
More About
Version History
Introduced in R2009b