Main Content

mslowess

Smooth signal with peaks using nonparametric method

    Description

    mslowess(X,Intensities) smooths raw noisy signal data, Intensities, using a locally weighted linear regression (Lowess) method with a default span of 10 samples and plots the result.

    Use mssgolay with data from any separation technique that produces signal data, such as spectroscopy, NMR, electrophoresis, chromatography, or mass spectrometry.

    mslowess assumes the input vector, X, may not have uniformly spaced separation units. Therefore, the sliding window for smoothing is centered using the closest samples in terms of the X value and not in terms of the X index.

    When the input vector, X, does not have repeated values or NaN values, the algorithm is approximately twice as fast.

    Yout = mslowess(X,Intensities) stores the smoothed data as Yout. This syntax does not plot the data.

    Yout = mslowess(X,Intensities,Name=Value) specifies options using one or more name-value arguments in addition to the arguments in the previous syntaxes.

    example

    Examples

    collapse all

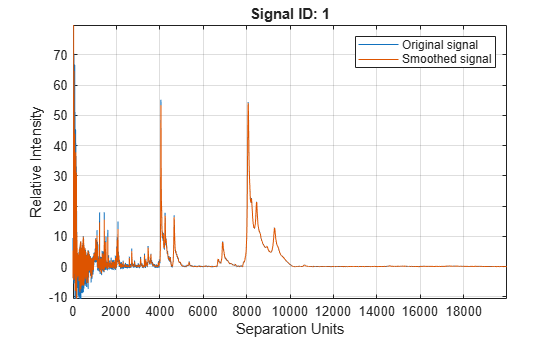
    Load a MAT-file, included with the Bioinformatics Toolbox™ software, that contains some sample data.

    load sample_lo_res

    Smooth the spectra and draw a figure of the first spectrum with original and smoothed signals.

    YS = mslowess(MZ_lo_res,Y_lo_res,ShowPlot=true);

    Figure contains an axes object. The axes object with title Signal ID: 1, xlabel Separation Units, ylabel Relative Intensity contains 2 objects of type line. These objects represent Original signal, Smoothed signal.

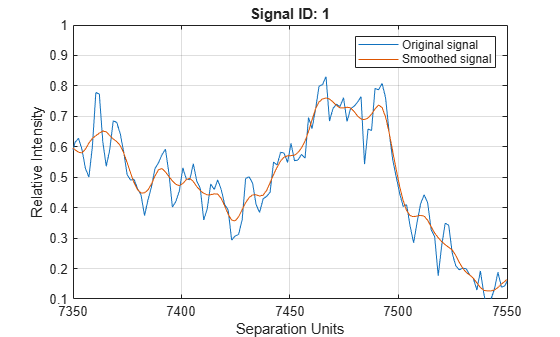
    Zoom in on a region of the figure to see the difference in the original and smoothed signals.

    axis([7350 7550 0.1 1.0])

    Figure contains an axes object. The axes object with title Signal ID: 1, xlabel Separation Units, ylabel Relative Intensity contains 2 objects of type line. These objects represent Original signal, Smoothed signal.

    Input Arguments

    collapse all

    Separation-unit values for a set of signals with peaks, specified as a vector with the number of elements equal to the number of rows in the matrix Intensities. The separation unit can quantify wavelength, frequency, distance, time, or m/z depending on the instrument that generates the signal data.

    Data Types: double

    Intensity values for a set of peaks that share the same separation-unit range, specified as a matrix. Each row of the matrix corresponds to a separation-unit value, and each column corresponds to either a set of signals with peaks or a retention time. The number of rows equals the number of elements in vector X.

    Data Types: double

    Name-Value Arguments

    collapse all

    Specify optional pairs of arguments as Name1=Value1,...,NameN=ValueN, where Name is the argument name and Value is the corresponding value. Name-value arguments must appear after other arguments, but the order of the pairs does not matter.

    Example: Order=2

    Order of Lowess smoother, specified as 1 (linear polynomial fit or Lowess), 2 (quadratic polynomial fit or Loess), or (equivalent to a weighted local mean estimator and presumably faster because only a mean computation is performed instead of a least-squares regression).

    Note

    Curve Fitting Toolbox™ software also refers to Lowess smoothing of order 2 as Loess smoothing.

    Data Types: double

    Window size for the smoothing kernel, specified as a positive number. Higher values smooth the signal more at the expense of computation time.

    • If this value is greater than 1, the window is equal to Span number of samples independent of the separation-unit vector, X.

    • If Span is less than 1, the window size is taken to be a fraction of the number of points in the data. For example, when Span is 0.005, the window size is equal to 0.50% of the number of points in X.

    Data Types: double

    Function for weighting the observed intensities, specified as one of these values:

    • "tricubic"(1-(dist/dmax).^3).^3

    • "gaussian"exp(-(2*dist/dmax).^2)

    • "linear"1-dist/dmax

    Samples close to the separation-unit location being smoothed have the most weight in determining the estimate.

    Data Types: char | string

    Number of iterations for a robust fit, specified as a nonnegative integer. If the value is 0, no robust fit is performed. For robust smoothing, small residual values at every span are outweighed to improve the new estimate. 1 or 2 robust iterations are usually adequate, while larger values might be computationally expensive.

    Note

    For an X vector that has uniformly spaced separation units, a nonrobust smoothing with Order equal to 0 is equivalent to filtering the signal with the kernel vector.

    Data Types: double

    Indicator to plot the smoothed and original data, specified as:

    • true— Plot the smoothed data over the first signal specified in the Intensities argument of the original data.

    • false—Do not plot the data.

    • Positive integer N— Plot the smoothed data over the Nth signal specified in the Intensities argument of the original data.

    The default value for plotting depends on the output argument, Yout:

    • For a syntax without an output argument, the default value is false.

    • For a syntax with an output argument, the default value is true.

    Data Types: double | logical

    Output Arguments

    collapse all

    Smoothed data, returned as a matrix.

    Version History

    Introduced before R2006a