Eye Diagram
Libraries:
Communications Toolbox /
Comm Sinks
Communications Toolbox HDL Support /
Comm Sinks
Mixed-Signal Blockset /
Utilities
SerDes Toolbox /
Utilities
Description
The Eye Diagram block displays multiple traces of a modulated signal to produce an eye diagram. You can use the block to reveal the modulation characteristics of the signal, such as the effects of pulse shaping or channel distortions.
The Eye Diagram block has one input port. This block accepts a column vector or scalar input signal. The block accepts a signal with the following data types: double, single, base integer, and fixed point. All data types are cast as double before the block displays results.
To modify the eye diagram display, select SCOPE and click the
Settings button (![]() ) in CONFIGURATION.
) in CONFIGURATION.
Examples
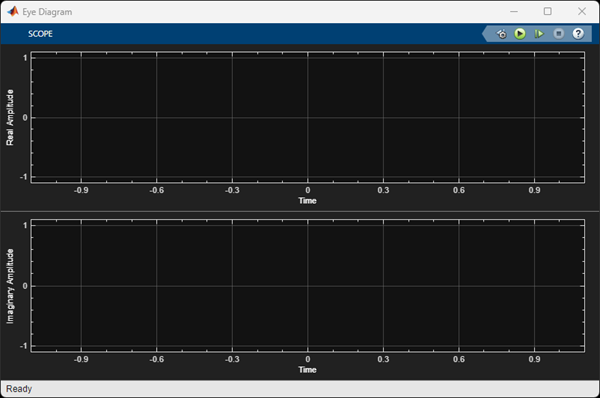
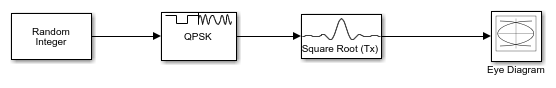
Display the eye diagram of a filtered QPSK signal using the Eye Diagram block.
Open the model EyeDiagramofQPSKSignal. Run the model and observe the eye diagram displayed.

Ports
Input
Parameters
Display and Traces
Number of samples per symbol, specified as a positive integer. Use with Symbols per trace to determine the number of samples per trace.
Tunable: Yes
Sample offset, specified as a nonnegative integer smaller than the product of Samples per symbol and Symbols per trace. The offset provides the number of samples to omit before plotting the first point.
Tunable: Yes
Number of symbols plotted per trace, specified as a positive integer.
Tunable: Yes
Number of traces plotted, specified as a positive integer.
Tunable: Yes
Dependencies
Select this check box to fade the points in the display as the interval of time after they are first plotted increases.
Select this check box to display the imaginary plot of the eye diagram.
Axes and Labels
Text that the scope displays along the real axis.
Tunable: Yes
Label that appears above the eye diagram plot.
Tunable: Yes
Text that the scope displays along the imaginary axis.
Tunable: Yes
Lower and upper limit values of the y-axis.
Tunable: Yes
Select this radio button to show the grid on the scope window.
COLOR AND STYLING
Use this tab to customize the style of the active display. You can change the color of the figure containing the displays, the background and foreground colors of display axes, and properties of lines in a display.
Select this radio button to preserve the colors when copying to a clipboard.
Specify the background color for the plot..
Specify the fill and line colors for the axes.
Specify the color of the labels on the axes.
Specify the line style for the displayed signal.
Specify the line thickness for the lines on displayed signal.
Data point marker for the selected signal, specified as one of the
choices in this table data point markers. This parameter is similar to
the Marker property for MATLAB®
Handle Graphics® plot objects.
| Specifier | Marker Type |
|---|---|
| none | No marker (default) |
|
| Circle |
|
| Square |
|
| Cross |
|
| Point |
|
| Plus sign |
|
| Asterisk |
|
| Diamond |
|
| Downward-pointing triangle |
|
| Upward-pointing triangle |
|
| Left-pointing triangle |
|
| Right-pointing triangle |
|
| Five-pointed star (pentagram) |
|
| Six-pointed star (hexagram) |
Specify the color for the lines on displayed signal.
Block Characteristics
Data Types |
|
Direct Feedthrough |
|
Multidimensional Signals |
|
Variable-Size Signals |
|
Zero-Crossing Detection |
|
More About
When an Eye Diagram block is placed in a conditionally executed subsystem, for example in a triggered or enabled subsystem:
Input size must be an integer multiple of
SamplesPerSymbol*SymbolsPerTraceSample offset must be zero
The rightmost part of the display is intentionally omitted. This figure compares typical eye diagram display when placed in a normal system versus one placed in a conditionally executed subsystem.
Eye Diagram Plot in Normal System Eye Diagram Plot in Conditionally Executed Subsystem 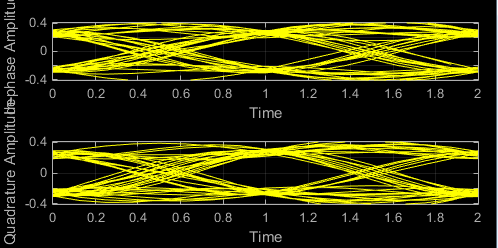
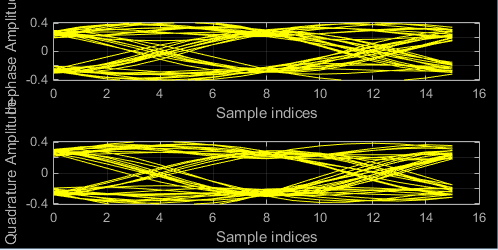
In a regular Eye Diagram, the rightmost part is a line between the last sample of a trace and the first sample of the next trace. In conditionally executed subsystems, these traces may be non-contiguous, thus this rightmost segment could corrupt the display and is omitted.
Extended Capabilities
Version History
Introduced in R2023b