MATLAB Help Center
Set cost value of cells in vehicle costmap
setCosts(costmap,xyPoints,costVals)
setCosts(costmap,xyPoints,costVals) sets the costs, costVals, for the (x, y) points in xyPoints in the vehicle costmap.
costmap
xyPoints
costVals
example
collapse all
Create a 10-by-15 meter vehicle costmap. Cells have a side length of 1 meter.
costmap = vehicleCostmap(10,15);
Define a set of (x,y) coordinates that correspond to a 3-by-5 meter rectangle.
[x,y] = meshgrid(2:4,2:6); xyPoints = [x(:),y(:)];
Mark the rectangle as an obstacle by increasing the cost of its cells to 0.9.
costVal = 0.9; setCosts(costmap,xyPoints,costVal); plot(costmap) title('Costmap with Rectangular Obstacle')
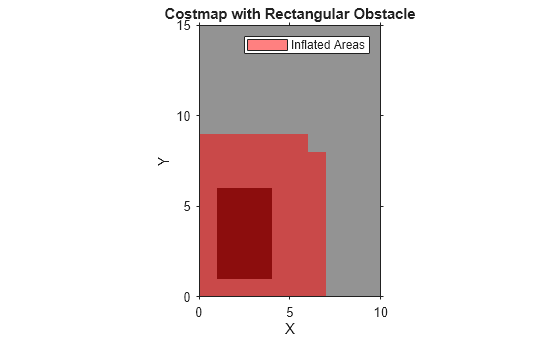
vehicleCostmap
Costmap, specified as a vehicleCostmap object.
Points, specified as an M-by-2 real-valued matrix that represents the (x, y) coordinates of M points.
Example: [3.4 2.6] specifies a single point at (3.4, 2.6)
[3.4 2.6]
Example: [3 2;3 3;4 7] specifies three points: (3, 2), (3, 3), and (4, 7)
[3 2;3 3;4 7]
Cost of points in xyPoints, specified as an M-element real-valued vector.
Example: 0.8 specifies the cost of a single point
0.8
Example: [0.2 0.5 0.8] specifies the cost of three points
[0.2 0.5 0.8]
expand all
Introduced in R2018a
getCosts | vehicleCostmap
getCosts
You clicked a link that corresponds to this MATLAB command:
Run the command by entering it in the MATLAB Command Window. Web browsers do not support MATLAB commands.
Select a Web Site
Choose a web site to get translated content where available and see local events and offers. Based on your location, we recommend that you select: .
You can also select a web site from the following list
How to Get Best Site Performance
Select the China site (in Chinese or English) for best site performance. Other MathWorks country sites are not optimized for visits from your location.
Americas
Europe
Asia Pacific
Contact your local office