Calculate Properties of Image Regions Using Image Region Analyzer
This example shows how to calculate the properties of regions in binary images by using the Image Region Analyzer app. This example finds the largest region, measured by area, in the image.
Read a binary image into the workspace.
BW = imread("text.png");Open the image in the Image Region Analyzer app by using the imageRegionAnalyzer function.
imageRegionAnalyzer(BW);
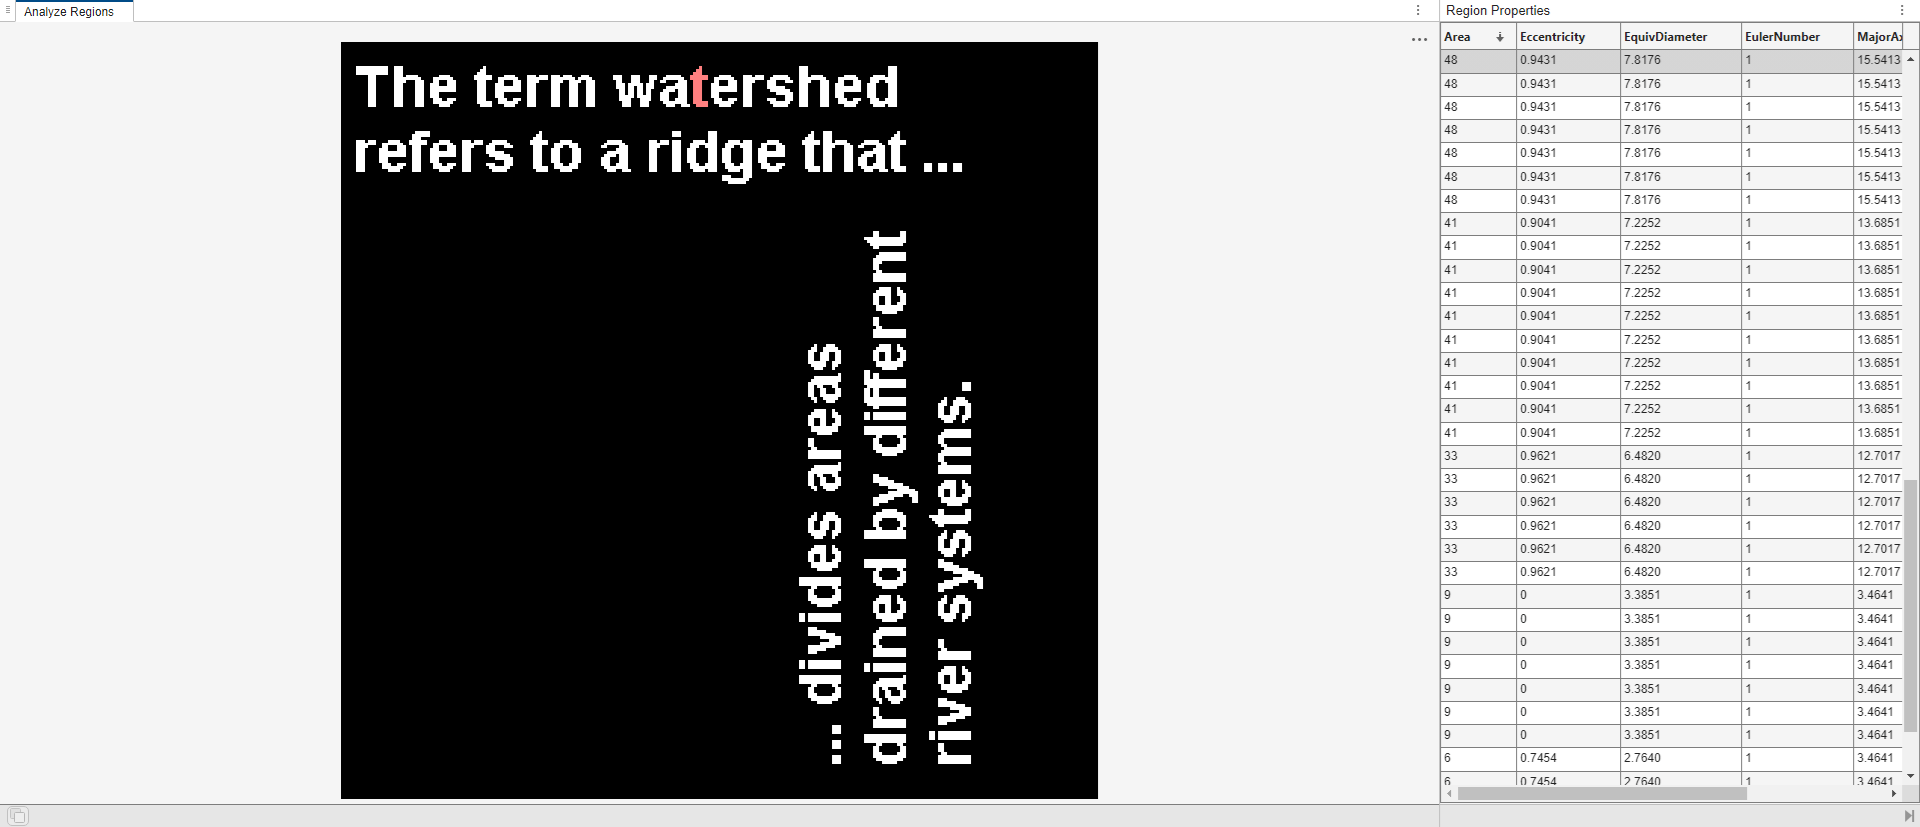
The Image Region Analyzer app displays the binary image and a table with region properties. In the table, each row is a region identified in the image and each column is a property of that region, such as the area, perimeter, and orientation.
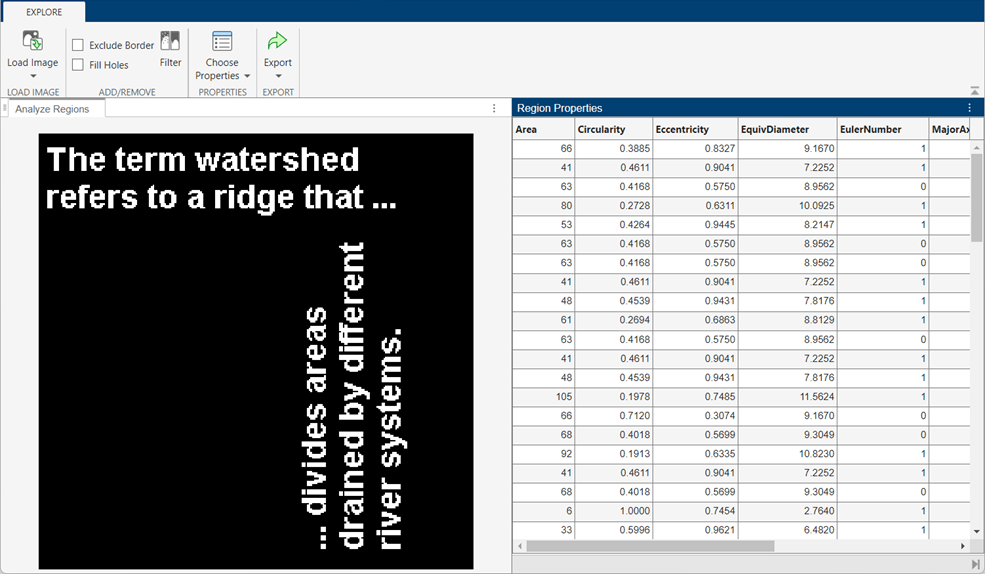
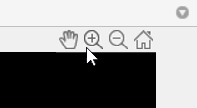
To access the image exploration controls such as pan and zoom, move the cursor over the image.
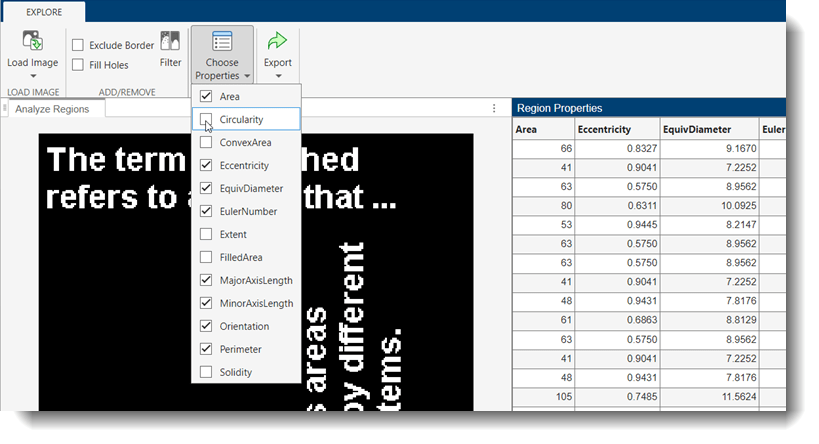
The app initially displays all the available properties. To remove or add properties to the table, click Choose Properties and select the properties you want to view. The app updates the table automatically.
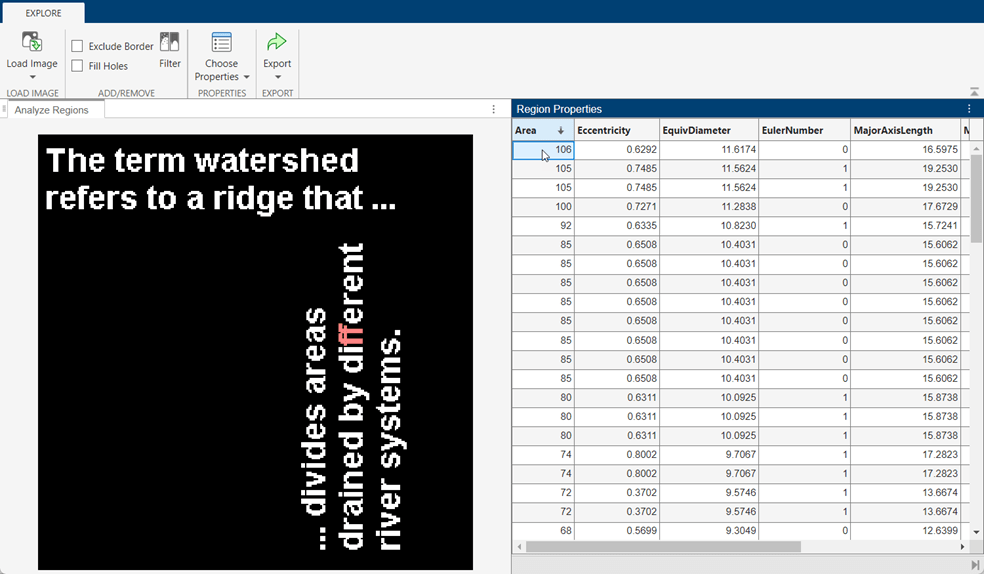
Initially, the app lists the regions in the order it finds them, starting in the upper-left corner of the image. To change the sorting order, click the sort icon next to a property name in the table. The app sorts the regions in increasing order. Click again to sort the regions in decreasing order.
For example, to sort the regions in the image from largest area to smallest area, click on the sort icon for the Area property twice.

To view the region in the image with the largest area, click the first row in the table. The app highlights the corresponding region in the image.
To view the area and other properties of a region in the image, select the region in the image. The app highlights the corresponding row in the table.
See Also
Image Region Analyzer | bwpropfilt | bwareafilt | regionprops