Quadtree Decomposition
Quadtree decomposition is an analysis technique that involves subdividing an image into blocks that are more homogeneous than the image itself. This technique reveals information about the structure of the image. It is also useful as the first step in adaptive compression algorithms.
You can perform quadtree decomposition using the qtdecomp function. This function works by dividing a square image into
four equal-sized square blocks, and then testing each block to see if it meets some
criterion of homogeneity (for example, if all the pixels in the block are within a
specific dynamic range). If a block meets the criterion, it is not divided any further.
If it does not meet the criterion, it is subdivided again into four blocks, and the test
criterion is applied to those blocks. This process is repeated iteratively until each
block meets the criterion. The result might have blocks of several different sizes.
Blocks can be as small as 1-by-1, unless you specify otherwise.
qtdecomp returns the quadtree decomposition as a sparse matrix, the
same size as I. The nonzero elements represent the upper left corners
of the blocks. The value of each nonzero element indicates the block size.
Perform Quadtree Decomposition on an Image
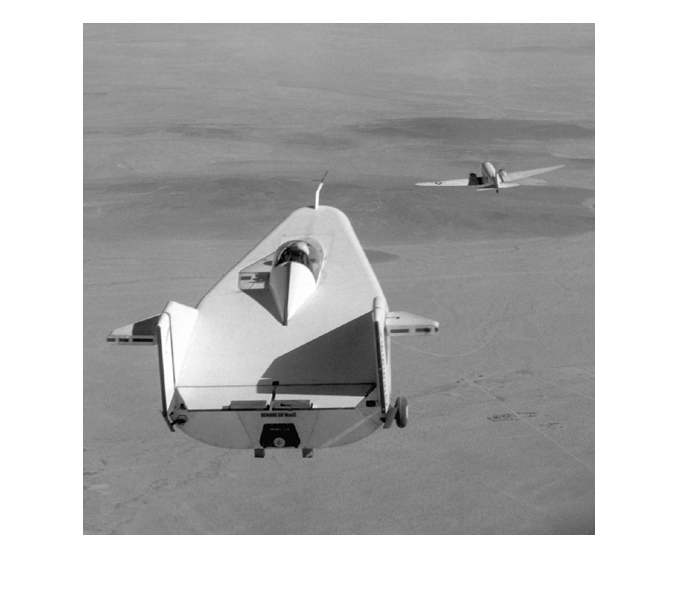
This example shows how to perform quadtree decomposition on a 512-by-512 grayscale image.
Read the grayscale image into the workspace.
I = imread('liftingbody.png');Perform the quadtree decomposition by calling the qtdecomp function, specifying as arguments the image and the test criteria used to determine the homogeneity of each block in the decomposition. For example, the criterion might be a threshold calculation such as max(block(:)) - min(block(:)) >= 0.27. You can also supply qtdecomp with a function (rather than a threshold value) for deciding whether to split blocks. For example, you might base the decision on the variance of the block.
S = qtdecomp(I,0.27);
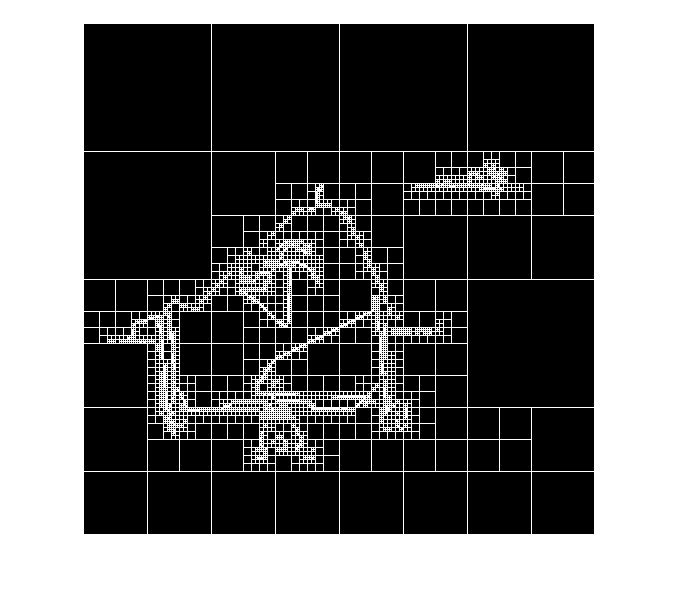
View a block representation of the quadtree decomposition. Each black square represents a homogeneous block, and the white lines represent the boundaries between blocks. Notice how the blocks are smaller in areas corresponding to large changes in intensity in the image.
blocks = repmat(uint8(0),size(S));

for dim = [512 256 128 64 32 16 8 4 2 1];
  numblocks = length(find(S==dim));
  if (numblocks > 0)
    values = repmat(uint8(1),[dim dim numblocks]);
    values(2:dim,2:dim,:) = 0;
    blocks = qtsetblk(blocks,S,dim,values);
  end
end

blocks(end,1:end) = 1;
blocks(1:end,end) = 1;

imshow(I), figure, imshow(blocks,[])