adaptthresh
Adaptive image threshold using local first-order statistics
Description
T = adaptthresh(I)I. The adaptthresh function chooses
the threshold based on the local mean intensity (first-order statistics) in the
neighborhood of each pixel. The threshold T can be used with
the imbinarize function to convert the grayscale image to a
binary image.
T = adaptthresh(I,sensitivity)
T = adaptthresh(___,Name=Value)
Examples
Read image into the workspace.
I = imread('rice.png');Use adaptthresh to determine threshold to use in binarization operation.
T = adaptthresh(I, 0.4);
Convert image to binary image, specifying the threshold value.
BW = imbinarize(I,T);
Display the original image with the binary version, side-by-side.
figure
imshowpair(I, BW, 'montage')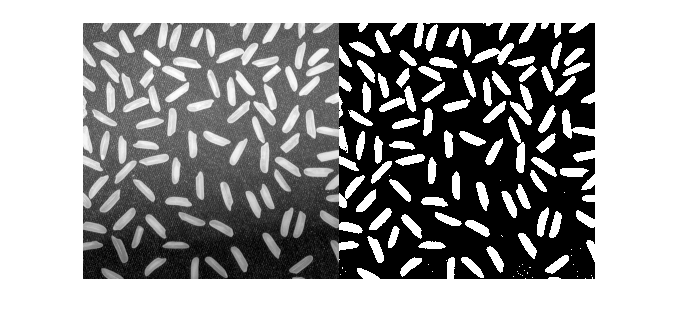
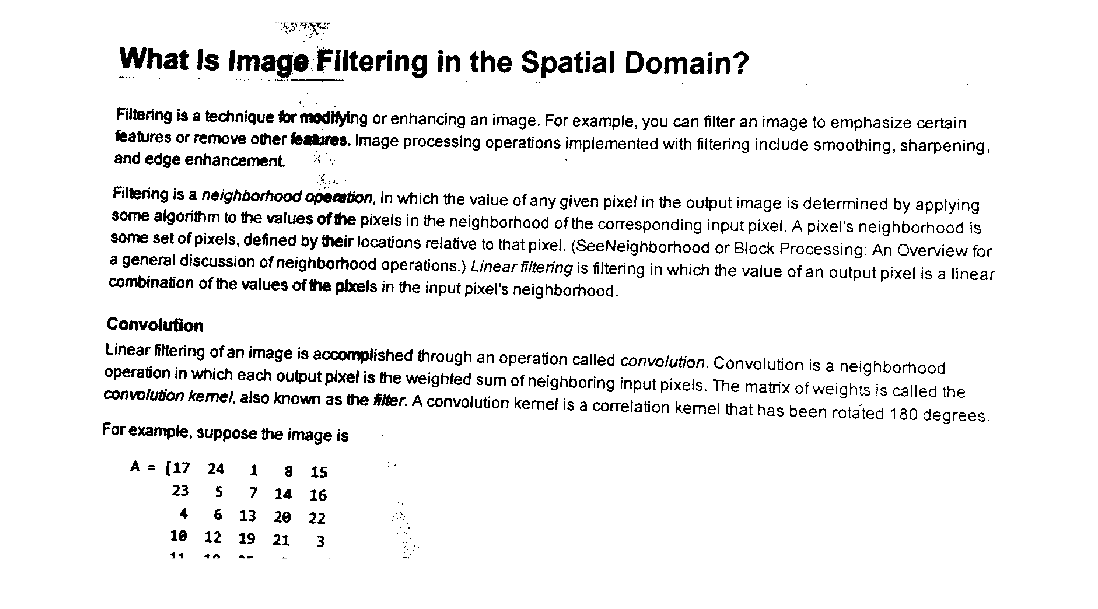
Read image into the workspace.
I = imread('printedtext.png');Using adaptthresh compute adaptive threshold and display the local threshold image. This represents an estimate of average background illumination.
T = adaptthresh(I,0.4,'ForegroundPolarity','dark');
figure
imshow(T)

Binarize image using locally adaptive threshold.
BW = imbinarize(I,T);
figure
imshow(BW)
Load 3-D volume into the workspace.
load mristack;
V = mristack;
Display the data.
figure
slice(double(V),size(V,2)/2,size(V,1)/2,size(V,3)/2)
colormap gray
shading interp
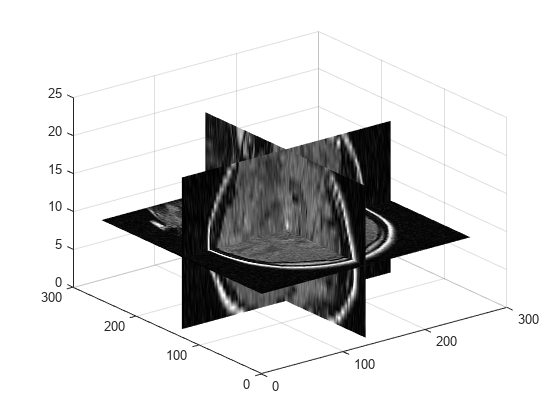
Calculate the threshold.
J = adaptthresh(V,'neigh',[3 3 3],'Fore','bright');
Display the threshold.
figure
slice(double(J),size(J,2)/2,size(J,1)/2,size(J,3)/2)
colormap gray
shading interp

Input Arguments
Name-Value Arguments
Output Arguments
References
[1] Bradley, D., G. Roth, "Adapting Thresholding Using the Integral Image," Journal of Graphics Tools. Vol. 12, No. 2, 2007, pp.13–21.