smileMetric
Compute spectral smile metrics of hyperspectral data
Description
[
computes the column mean derivatives, and their standard deviations, for the oxygen and
carbon-dioxide absorption features of a hyperspectral data set. You can use these values to
detect the spectral smile effect in the hyperspectral data set. For more information, see
Smile Indicators.oxystd
,carbonstd
,oxyderiv
,carbonderiv
] = smileMetric(hcube
)
Note
This function requires the Image Processing Toolbox™ Hyperspectral Imaging Library. You can install the Image Processing Toolbox Hyperspectral Imaging Library from Add-On Explorer. For more information about installing add-ons, see Get and Manage Add-Ons.
Examples
Compute Derivative Values for Oxygen and Carbon-Dioxide Absorption Features
Load the hyperspectral data into the workspace.
hcube = hypercube('EO1H0440342002212110PY_cropped.dat');
Compute the column mean derivative values, and their standard deviations, for the oxygen and carbon-dioxide absorption features of the hyperspectral dataset hcube
.
[oxystd,carbonstd,oxyderiv,carbonderiv] = smileMetric(hcube);
Perform spectral smile reduction using the maximum noise fraction (MNF) transform-based method.
correctedData = reduceSmile(hcube,'Method','MNF');
Compute the column mean derivative values, and their standard deviations, for the oxygen and carbon-dioxide absorption features of the smile-corrected hyperspectral dataset correctedData
.
[noxystd,ncarbonstd,noxyderiv,ncarbonderiv] = smileMetric(correctedData);
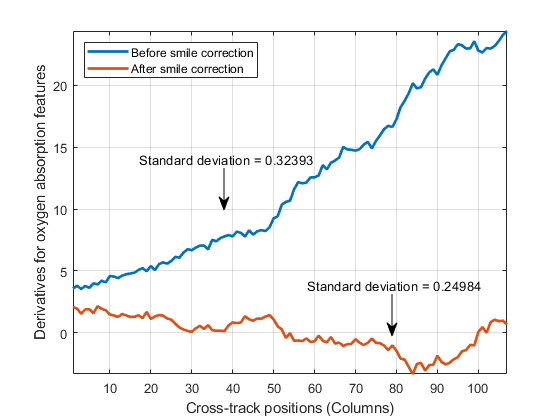
Plot the column mean derivative values of the oxygen absorption feature for both the uncorrected hypercube hcube
and the smile-corrected hypercube correctedData
, and display their standard deviations.
figure plot(oxyderiv,'LineWidth',2) hold on plot(noxyderiv,'LineWidth',2) hold off axis tight grid on xlabel('Cross-track positions (Columns)') ylabel('Derivatives for oxygen absorption features') legend({'Before smile correction','After smile correction'},'Location','northwest'); annotation(gcf,'textarrow',[0.4 0.4],[0.6 0.5],... 'String',['Standard deviation = ' num2str(oxystd)]); annotation(gcf,'textarrow',[0.7 0.7],[0.3 0.2],... 'String',['Standard deviation = ' num2str(noxystd)]);
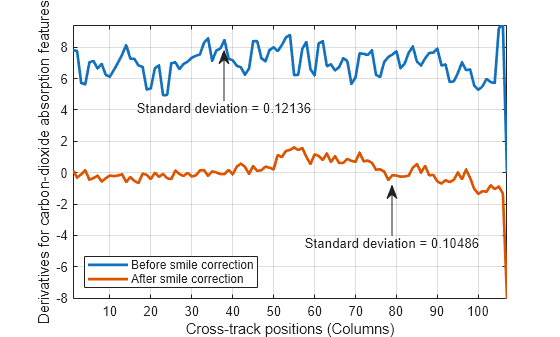
Plot the column mean derivative values of the carbon-dioxide absorption feature for both the uncorrected hypercube hcube
and the smile-corrected hypercube correctedData
, and display their standard deviations.
figure plot(carbonderiv,'LineWidth',2) hold on plot(ncarbonderiv,'LineWidth',2) hold off axis tight grid on xlabel('Cross-track positions (Columns)') ylabel('Derivatives for carbon-dioxide absorption features') legend({'Before smile correction','After smile correction'},'Location','southwest'); annotation(gcf,'textarrow',[0.4 0.4],[0.7 0.85],... 'String',['Standard deviation = ' num2str(carbonstd)]); annotation(gcf,'textarrow',[0.7 0.7],[0.3 0.45],... 'String',['Standard deviation = ' num2str(ncarbonstd)]);
Input Arguments
hcube
— Input hyperspectral data
hypercube
object
Input hyperspectral data, specified as a hypercube
object. The DataCube
property of the hypercube
object stores the hyperspectral data cube. To calculate the column mean of oxygen and
carbon-dioxide absorption feature derivatives, the hypercube
object must have the full width half maximum (FWHM
) values in the
Metadata
property.
Note
To compute the column mean of oxygen absorption feature derivatives, the input hyperspectral data must contain data in the visible and near-infrared (VNIR) wavelength range 760 - 785 nm.
To compute the column mean of carbon-dioxide absorption feature derivatives, the input hyperspectral data must contain data in the short-wave-infrared (SWIR) wavelength range 2010 - 2025 nm.
Output Arguments
oxyderiv
— Column mean derivatives for oxygen absorption features
N-element row vector
Column mean derivatives for the oxygen absorption features, returned as a
N-element row vector. N is the number of columns
in the input hyperspectral data cube. If the input hyperspectral data cube is of type
double
, then the output vector is of data type
double
. Otherwise, the data type of the output vector is
single
.
carbonderiv
— Column mean derivative for carbon-dioxide absorption features
N-element row vector
Column mean derivatives for the carbon-dioxide absorption features, returned as a
N-element row vector. N is the number of columns
in the input hyperspectral data cube. If the input hyperspectral data cube is of type
double
, then the output vector is of data type
double
. Otherwise, the data type of the output vector is
single
.
oxystd
— Standard deviation of column mean derivatives for oxygen absorption features
scalar
Standard deviation of the column mean derivatives for oxygen absorption features,
returned as a scalar. You can use this scalar to detect the presence of the spectral
smile effect in hyperspectral data. If the value of oxystd
is low,
then the chances of the data having a smile effect is less in the VNIR range.
carbonstd
— Standard deviation of column mean derivatives for carbon-dioxide absorption features
scalar
Standard deviation of the column mean derivatives for carbon-dioxide absorption
features, returned as a scalar. You can use this scalar to detect the presence of the
spectral smile effect in hyperspectral data. If the value of
carbonstd
is low, then the chances of the data having a smile
effect is less in the SWIR range.
More About
Smile Indicators
The smile effect occurs when hyperspectral data contains significant cross-track curvature with nonlinear disturbances along the spectral dimension. These nonlinear disturbances occur only in data captured using push-broom hyperspectral sensors, such as the Hyperion EO-1 and SEBASS. Based on [1], you can detect cross-track variation in the oxygen and carbon-dioxide absorption features, due to a possible smile effect, by calculating the first derivatives of the oxygen and carbon-dioxide band images. The first derivative of the adjacent bands is calculated using the absorption band image and the image of the subsequent band , using the equation:
where, is the average FWHM of the two bands and . This derivative calculation is applicable to both the oxygen and carbon-dioxide absorption band images. The column mean values of the oxygen and carbon-dioxide derivatives can indicate cross-track nonlinearity caused by the spectral smile effect.
The nonlinear, cross-track column mean of oxygen absorption feature derivative values indicates a spectral smile effect in the VNIR spectrum.
The nonlinear, cross-track column mean of carbon-dioxide absorption feature derivative values indicates a spectral smile effect in the SWIR spectrum.
References
[1] Dadon, Alon, Eyal Ben-Dor, and Arnon Karnieli. “Use of Derivative Calculations and Minimum Noise Fraction Transform for Detecting and Correcting the Spectral Curvature Effect (Smile) in Hyperion Images.” IEEE Transactions on Geoscience and Remote Sensing 48, no. 6 (June 2010): 2603–12. https://doi.org/10.1109/TGRS.2010.2040391.
Version History
Introduced in R2021a
See Also
Open Example
You have a modified version of this example. Do you want to open this example with your edits?
MATLAB Command
You clicked a link that corresponds to this MATLAB command:
Run the command by entering it in the MATLAB Command Window. Web browsers do not support MATLAB commands.
Select a Web Site
Choose a web site to get translated content where available and see local events and offers. Based on your location, we recommend that you select: .
You can also select a web site from the following list:
How to Get Best Site Performance
Select the China site (in Chinese or English) for best site performance. Other MathWorks country sites are not optimized for visits from your location.
Americas
- América Latina (Español)
- Canada (English)
- United States (English)
Europe
- Belgium (English)
- Denmark (English)
- Deutschland (Deutsch)
- España (Español)
- Finland (English)
- France (Français)
- Ireland (English)
- Italia (Italiano)
- Luxembourg (English)
- Netherlands (English)
- Norway (English)
- Österreich (Deutsch)
- Portugal (English)
- Sweden (English)
- Switzerland
- United Kingdom (English)