Explore Layers on Same Server
You might find a layer you like in the WMS Database and want to find other layers on the same server. You can explore other layers by using a capabilities document.
Specify the URL of the NASA SVS Image Server. Use the wmsinfo function to return the contents of the capabilities document as a WMSCapabilities object. A capabilities document is an XML document containing metadata that describes the geographic content a server offers.
serverURL = "http://svs.gsfc.nasa.gov/cgi-bin/wms?";
capabilities = wmsinfo(serverURL);
Set the layer titles to a variable. View the first three titles.
layerTitles = {capabilities.Layer.LayerTitle}';
layerTitles(1:3)
ans = 3×1 cell
{'African Fires During 2002 (1024x1024 Animation)' }
{'Background Image for African Fires During 2002 (WMS)' }
{'Aurora over the North Pole on April 17, 1999 (360x100 Animation)'}
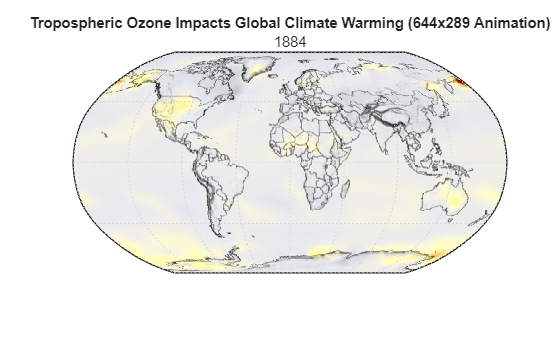
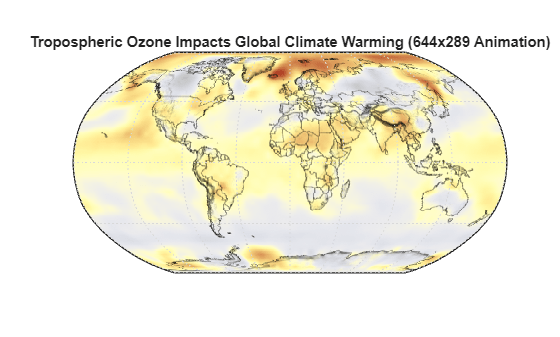
Read the layer containing tropospheric ozone impacts. Display the map.
layerTitle = "Tropospheric Ozone Impacts Global Climate Warming";
layer = refine(capabilities.Layer,layerTitle);
[A,R] = wmsread(layer);

figure
worldmap(A,R)
geoshow(A,R)
title(layer.LayerTitle)
plabel off
mlabel off
This layer contains data from different years. You can examine the available data by accessing the layer.Details.Dimension structure.
layer.Details.Dimension
ans = struct with fields:
              Name: 'time'
             Units: 'ISO8601'
        UnitSymbol: ''
           Default: '1994-'
    MultipleValues: 0
      NearestValue: 0
           Current: 0
            Extent: '1884-/1994-/P1Y'
Display the map for the year 1884 and compare it with the map for 1994, the default year (displayed previously).
year = "1884";
[A2,R] = wmsread(layer,Time=year);
figure
worldmap(A2,R)
geoshow(A2,R)
title(layer.LayerTitle,year)
plabel off
mlabel off