errorbar
Line plot with error bars
Syntax
Description
errorbar(___, sets the orientation
of the error bars. Specify ornt)ornt as
"horizontal" for horizontal error bars or
"both" for both horizontal and vertical error bars. The
default for ornt is "vertical", which
draws vertical error bars. Use this option after any of the previous input
argument combinations.
errorbar(___, sets the line
style, marker symbol, and color. For example, LineSpec)"--ro" plots a
dashed, red line with circle markers. The line style affects only the line and
not the error bars.
errorbar(___, modifies the
appearance of the line and error bars using one or more name-value pair
arguments. For example, Name,Value)"CapSize",10 sets the lengths of the
caps at the end of each error bar to 10 points.
errorbar( creates
the plot in the axes specified by ax,___)ax instead of
in the current axes. Specify the axes as the first input argument.
e = errorbar(___)ErrorBar object for each plotted line. Use
e to modify properties of a specific ErrorBar object after it is created. For a list of
properties, see ErrorBar Properties.
Examples
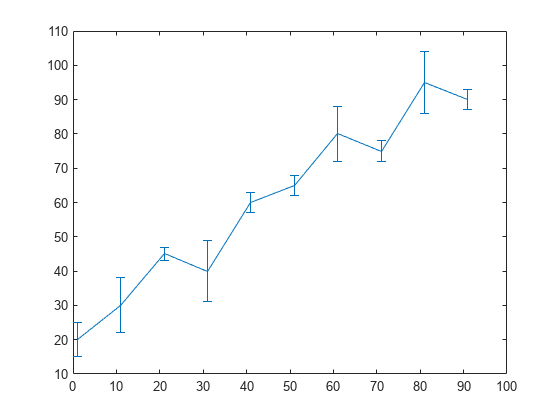
Create vectors x and y. Plot y versus x. At each data point, display vertical error bars that are equal in length.
x = 1:10:100;
y = [20 30 45 40 60 65 80 75 95 90];
err = 8*ones(size(y));
errorbar(x,y,err)

Create a line plot with error bars at each data point. Vary the lengths of the error bars.
x = 1:10:100;
y = [20 30 45 40 60 65 80 75 95 90];
err = [5 8 2 9 3 3 8 3 9 3];
errorbar(x,y,err)
Create a line plot with horizontal error bars at each data point.
x = 1:10:100;
y = [20 30 45 40 60 65 80 75 95 90];
err = [1 3 5 3 5 3 6 4 3 3];
errorbar(x,y,err,'horizontal')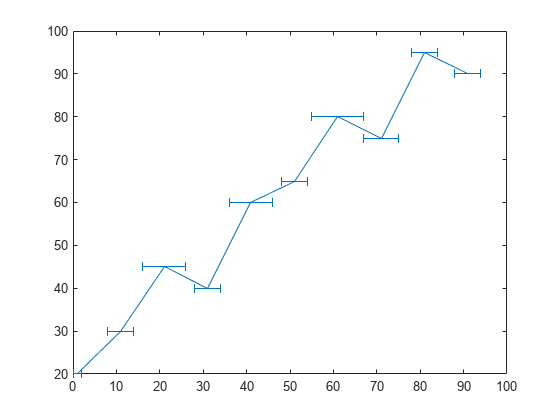
Create a line plot with both vertical and horizontal error bars at each data point.
x = 1:10:100;
y = [20 30 45 40 60 65 80 75 95 90];
err = [4 3 5 3 5 3 6 4 3 3];
errorbar(x,y,err,'both')
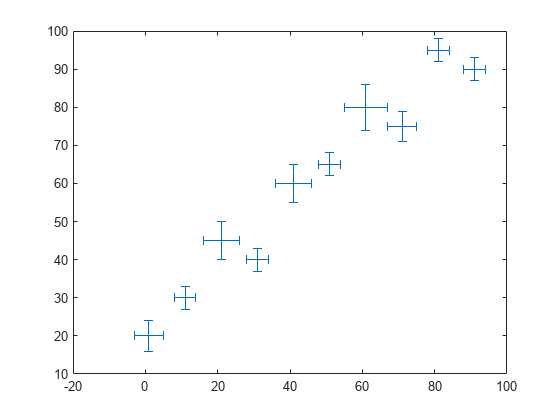
Plot vectors y versus x. At each data point, display a circle marker with both vertical and horizontal error bars. Do not display the line that connects the data points by omitting the line style option for the linespec input argument.
x = 1:10:100;
y = [20 30 45 40 60 65 80 75 95 90];
err = [4 3 5 3 5 3 6 4 3 3];
errorbar(x,y,err,"both","o")

Alternatvely, omit the markers and plot the error bars by themselves. To do this, specify the LineStyle name-value argument as "none".
errorbar(x,y,err,"both","LineStyle","none")
Display both vertical and horizontal error bars at each data point. Control the lower and upper lengths of the vertical error bars using the yneg and ypos input argument options, respectively. Control the left and right lengths of the horizontal error bars using the xneg and xpos input argument options, respectively.
x = 1:10:100;
y = [20 30 45 40 60 65 80 75 95 90];
yneg = [1 3 5 3 5 3 6 4 3 3];
ypos = [2 5 3 5 2 5 2 2 5 5];
xneg = [1 3 5 3 5 3 6 4 3 3];
xpos = [2 5 3 5 2 5 2 2 5 5];
errorbar(x,y,yneg,ypos,xneg,xpos,'o')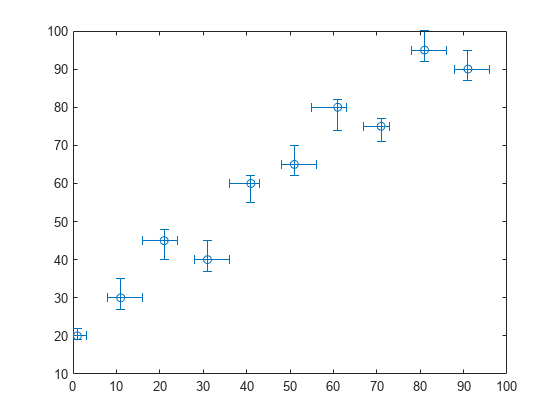
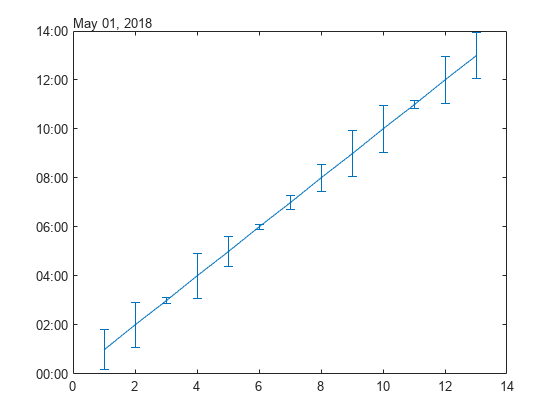
Create a plot of datetime values with error bars in duration units.
x = 1:13;
y = datetime(2018,5,1,1:13,0,0);
err = hours(rand(13,1));
errorbar(x,y,err)
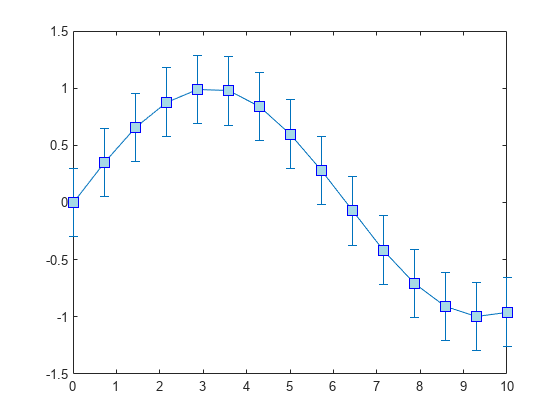
Create a line plot with error bars. At each data point, display a marker. Change the appearance of the marker using name-value arguments. Use MarkerSize to specify the marker size in points. Use MarkerEdgeColor and MarkerFaceColor to specify the marker outline and fill colors, respectively. You can specify colors by name, such as "blue", RGB triplets, or hexadecimal color codes.
x = linspace(0,10,15);
y = sin(x/2);
err = 0.3*ones(size(y));
errorbar(x,y,err,"-s","MarkerSize",10,...
    "MarkerEdgeColor","blue","MarkerFaceColor",[0.65 0.85 0.90])
Control the size of the caps at the end of each error bar by setting the CapSize property to a positive value in points.
x = linspace(0,2,15);
y = exp(x);
err = 0.3*ones(size(y));
e = errorbar(x,y,err,'CapSize',18);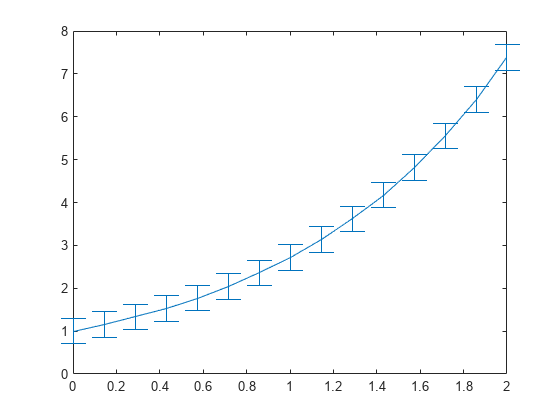
To remove the caps, set the cap size to zero. Then add a margin of padding around the inside of the plot box by calling the axis padded command. Adding this margin keeps the error bars from overlapping with the plot box.
e.CapSize = 0;
axis padded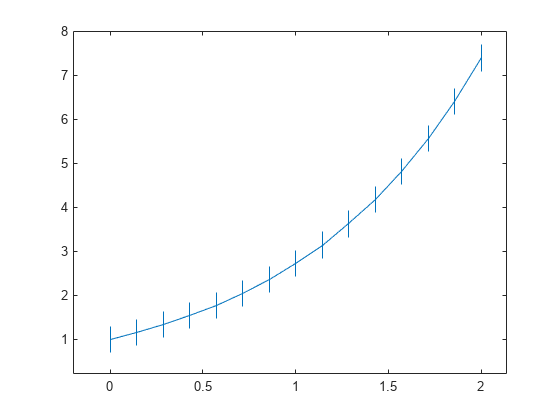
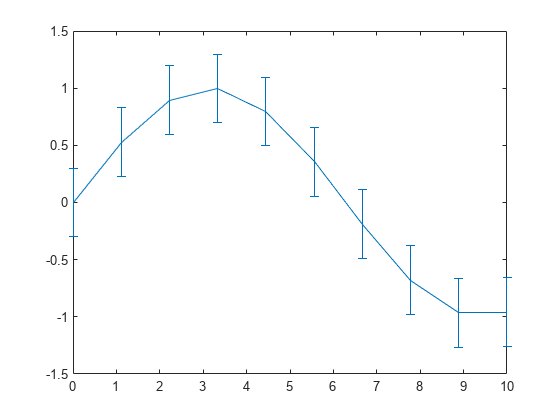
Create a line plot with error bars. Assign the errorbar object to the variable e.
x = linspace(0,10,10);
y = sin(x/2);
err = 0.3*ones(size(y));
e = errorbar(x,y,err)
e =
  ErrorBar with properties:

             Color: [0.0660 0.4430 0.7450]
         LineStyle: '-'
         LineWidth: 0.5000
            Marker: 'none'
             XData: [0 1.1111 2.2222 3.3333 4.4444 5.5556 6.6667 7.7778 8.8889 10]
             YData: [0 0.5274 0.8962 0.9954 0.7952 0.3558 -0.1906 -0.6797 -0.9643 -0.9589]
    XNegativeDelta: [1×0 double]
    XPositiveDelta: [1×0 double]
    YNegativeDelta: [0.3000 0.3000 0.3000 0.3000 0.3000 0.3000 0.3000 0.3000 0.3000 0.3000]
    YPositiveDelta: [0.3000 0.3000 0.3000 0.3000 0.3000 0.3000 0.3000 0.3000 0.3000 0.3000]

  Show all properties
Use e to access properties of the errorbar object after it is created.
e.Marker = '*';
e.MarkerSize = 10;
e.Color = 'red';
e.CapSize = 15;

Input Arguments
y-coordinates, specified as a vector or matrix. The
size and shape of y depend on the size and shape of your
data and the type of plot you want to make. This table describes the most
common types of plots you can create.
| Type of Plot | Coordinates and Error Bar Lengths |
|---|---|
| One line with error bars | Specify all coordinates and error bar lengths
as any combination of row and column vectors of the
same length. For example, plot one line with error
bars. Adjust the x-axis limits
with the
y = 1:5;
err = [0.3 0.1 0.3 0.1 0.3];
errorbar(y,err)
xlim([0.9 5.1])
Optionally specify
x = [0; 1; 2; 3; 4]; y = 1:5; err = [0.3 0.1 0.3 0.1 0.3]; errorbar(x,y,err) xlim([-0.1 4.1]) |
| Multiple lines with error bars | Specify one or more of the coordinate inputs or error bar lengths as matrices. All matrices must be the same size and orientation. If any inputs are specified as vectors, they must have the same number of elements, and they must have the same length as one of the dimensions of the matrices. MATLAB® plots one line for each column in the matrices in these situations:
For example, plot five lines that
each have two error bars. Adjust the
x-axis limits with the
y = [1 2 3 4 5;
     2 3 4 5 6];
err = [0.2 0.1 0.3 0.1 0.2;
       0.1 0.3 0.4 0.3 0.1];
errorbar(y,err)
xlim([0.95 2.05])
Using the same
x = [0 1 2 3 4;
     10 11 12 13 14];
y = [1 2 3 4 5];
err = [0.2 0.1 0.3 0.1 0.2;
       0.1 0.3 0.4 0.3 0.1];
errorbar(x,y,err)
xlim([-0.5 14.5]) |
Data Types: single | double | int8 | int16 | int32 | int64 | uint8 | uint16 | uint32 | uint64 | logical | categorical | datetime | duration
x-coordinates, specified as a vector or matrix. The
size and shape of x depend on the size and shape of your
data and the type of plot you want to make. This table describes the most
common types of plots you can create.
| Type of Plot | Coordinates and Error Bar Lengths |
|---|---|
| One line with error bars | Specify all coordinates and error bar lengths
as any combination of row and column vectors of the
same length. For example, plot one line with error
bars. Adjust the x-axis limits
with the
x = 0:4; y = [1; 2; 3; 4; 5]; err = [0.2 0.1 0.3 0.1 0.2]; errorbar(x,y,err) xlim([-0.1 4.1]) |
| Multiple lines with error bars | Specify one or more of the coordinate inputs or error bar lengths as matrices. All matrices must have the same size and orientation. If any inputs are specified as vectors, they must have the same number of elements, and they have the same length as of one of the dimensions of the matrices. MATLAB plots one line for each column in the matrices in these situations:
Otherwise, MATLAB plots one line for each row in the
matrices. For example, plot five lines that each
have two error bars. Adjust the
x-axis limits with the
x = [1 1 1 1 1;
     2 2 2 2 2];
y = [1 2 3 4 5;
     2 3 4 5 6];
err = [0.2 0.1 0.3 0.1 0.2;
       0.1 0.3 0.4 0.3 0.1];
errorbar(x,y,err)
xlim([0.95 2.05])
Using the same
x = 0:4;
y = [1 2 3 4 5;
     2 3 4 5 6];
err = [0.2 0.1 0.3 0.1 0.2;
       0.1 0.3 0.4 0.3 0.1];
errorbar(x,y,err)
xlim([-0.1 4.1])
|
Data Types: single | double | int8 | int16 | int32 | int64 | uint8 | uint16 | uint32 | uint64 | logical | categorical | datetime | duration
Error bar lengths for symmetrical error bars, specified as a vector or
matrix. If you do not want to draw an error bar at a particular data point,
then specify the length as NaN. The size and shape of
err depend on the size and shape of the coordinate
inputs and how you want to distribute the error bars. This table describes
the most common types of plots you can create.
| Type of Plot | x and y | err |
|---|---|---|
| One line with error bars |
| Specify a row or column vector of the same
length as
x = [0; 1; 2; 3; 4]; y = 1:5; err = [0.2 0.1 0.3 0.1 0.2]; errorbar(x,y,err) xlim([-0.1 4.1]) |
| Multiple lines with error bars | At least one of x or
y is a matrix | Specify a vector that is the same length as one
of the dimensions of the When you
specify a vector, the error bars are shared among
all the lines. For example, plot two lines that
share the same five error bars. Adjust the
x-axis limits with the
x = 1:5;
y = [1 2 3 4 5;
     2 3 4 5 6];
err = [0.2 0.1 0.3 0.1 0.2];
errorbar(x,y,err)
xlim([0.90 5.1])
To display different error bars for each
line, specify a matrix that has the same size and
orientation as the
x = 1:5;
y = [1 2 3 4 5;
     2 3 4 5 6];
err = [0.2 0.1 0.3 0.1 0.2;
       0.1 0.3 0.4 0.3 0.1];
errorbar(x,y,err)
xlim([0.90 5.1]) |
The data type of the error bar lengths must be compatible with the corresponding plot data. For example, if you plot datetime values, the error bars for those values must be duration values.
Data Types: single | double | int8 | int16 | int32 | int64 | uint8 | uint16 | uint32 | uint64 | logical | duration
Error bar lengths in the negative and positive directions, specified as a pair of vectors, a pair of matrices, or a vector and a matrix, separated by a comma. The negative direction is either below or to the left of the data points, depending on the orientation of the error bars. The positive direction is either above or to the right of the data points.
If you want to omit the negative or positive part of the error bar at a
particular data point, then specify the length at that point as
NaN. To omit the negative or positive part at all
data points, specify an empty array for neg or
pos.
The size and shape of neg and pos
depend on the size and shape of the coordinate inputs and how you want to
distribute the error bars. This table describes the most common types of
plots you can create.
| Type of Plot | x and y | neg and pos |
|---|---|---|
| One line with error bars |
| Specify row or column vectors of the same length as
x = [0; 1; 2; 3; 4]; y = 1:5; neg = [0.2; 0.1; 0.3; 0.05; 0.3]; pos = [0.1 0.05 0.1 0.2 0.3]; errorbar(x,y,neg,pos) xlim([-0.1 4.1]) |
| Multiple lines with error bars | At least one of x or
y is a matrix | Specify vectors that are the same length as one of
the dimensions of the When you specify vectors, those
error bar lengths are shared among all the lines. For
example, plot two lines that share the same negative and
positive error bar lengths. Adjust the
x-axis limits with the
x = 0:4;
y = [1 2 3 4 5;
     6 7 8 9 10];
neg = [0.2; 0.1; 0.3; 0.05; 0.3];
pos = [0.1 0.05 0.1 0.2 0.3];
errorbar(x,y,neg,pos)
xlim([-0.1 4.1])
To display different positive and negative
error bar lengths for each line, specify matrices that
are the same size and orientation as the
x = 0:4;
y = [1 2 3 4 5;
    6 7 8 9 10];
neg = [0.2 0.1 0.3 0.05 0.3;
    3 5 3 2 2];
pos = [0.2 0.3 0.4 0.1 0.2;
    4 3 3 7 3];
errorbar(x,y,neg,pos)
xlim([-0.1 4.1]) |
The data type of the error bar lengths must be compatible with the corresponding plot data. For example, if you plot datetime values, the error bars for those values must be duration values.
Data Types: single | double | int8 | int16 | int32 | int64 | uint8 | uint16 | uint32 | uint64 | logical | duration
Vertical error bar lengths in the negative and positive directions, specified as a pair of vectors, a pair of matrices, or a vector and a matrix, separated by a comma. The negative direction is below data points, and the positive direction is above data points.
If you want to omit the negative or positive part of the error bar at a
particular data point, then specify the length at that point as
NaN. To omit the negative or positive part at all
data points, specify an empty array for yneg or
ypos.
The size and shape of yneg and ypos
depend on the size and shape of the coordinate inputs and how you want to
distribute the error bars. This table describes the most common types of
plots you can create.
| Type of Plot | x and y | yneg and
ypos |
|---|---|---|
| One line with error bars |
| Specify row or column vectors of the same length as
x = [0; 1; 2; 3; 4]; y = 1:5; yneg = [0.2; 0.1; 0.3; 0.05; 0.3]; ypos = [0.1 0.05 0.1 0.2 0.3]; xneg = [0.1; 0.1; 0.1; 0.1; 0.1]; xpos = [0.1 0.1 0.1 0.1 0.1]; errorbar(x,y,yneg,ypos,xneg,xpos) xlim([-0.2 4.2]) |
| Multiple lines with error bars | At least one of x or
y is a matrix | Specify vectors that are the same length as one of
the dimensions of the When you specify vectors, those
error bar lengths are shared among all the lines. For
example, plot two lines that share the same negative and
positive vertical error bar lengths. Specify
x = 0:4;
y = [1 2 3 4 5;
     6 7 8 9 10];
yneg = [0.2; 0.3; 0.3; 0.1; 0.3];
ypos = [0.1 0.4 0.1 0.2 0.3];
errorbar(x,y,yneg,ypos,[],[])
xlim([-0.2 4.2])
To display different positive and negative
vertical lengths for each line, specify matrices that
have the same size and orientation as the
x = 0:4;
y = [1 2 3 4 5;
     6 7 8 9 10];
yneg = [0.3 1 0.2 0.5 0.3;
       0.3 0.2 0.3 1 0.5];
ypos = [1 0.4 0.3 0.2 0.3;
       0.4 0.5 0.2 0.4 1];
errorbar(x,y,yneg,ypos,[],[])
xlim([-0.2 4.2]) |
The data type of the error bar lengths must be compatible with the corresponding plot data. For example, if you plot datetime values, the error bars for those values must be duration values.
Data Types: single | double | int8 | int16 | int32 | int64 | uint8 | uint16 | uint32 | uint64 | logical | duration
Horizontal error bar lengths in the negative and positive directions, specified as a pair of vectors, a pair of matrices, or a vector and a matrix, separated by a comma. The negative direction is to the left of the data points, and the positive direction is to the right of the data points.
If you want to omit the negative or positive part of the error bar at a
particular data point, specify the length at that point as
NaN. To omit the negative or positive part at all
data points, then specify an empty array for xneg or
xpos.
The size and shape of xneg and xpos
depends on the size and shape of the coordinate inputs and how you want to
distribute the error bars. This table describes the most common types of
plots you can create.
| Type of Plot | x and y | xneg and
xpos |
|---|---|---|
| One line with error bars |
| Specify row or column vectors of the same length as
x = [0; 1; 2; 3; 4]; y = 1:5; yneg = [0.2; 0.1; 0.3; 0.05; 0.3]; ypos = [0.1 0.05 0.1 0.2 0.3]; xneg = [0.1; 0.1; 0.1; 0.1; 0.1]; xpos = [0.1 0.1 0.1 0.1 0.1]; errorbar(x,y,yneg,ypos,xneg,xpos) xlim([-0.2 4.2]) |
| Multiple lines with error bars | At least one of x or
y is a matrix | Specify vectors that are the same length as one of
the dimensions of the When you specify vectors, those
error bar lengths are shared among all the lines. For
example, plot two lines that share the same negative and
positive horizontal error bar lengths. Specify
x = 0:4;
y = [1 2 3 4 5;
     6 7 8 9 10];
xneg = [0.2; 0.3; 0.3; 0.1; 0.3];
xpos = [0.1 0.4 0.1 0.2 0.3];
errorbar(x,y,[],[],xneg,xpos)
xlim([-0.5 4.5])
ylim([0.5 10.5])
To display different positive and negative
horizontal lengths for each line, specify matrices that
have the same size and orientation as the
x = 0:4;
y = [1 2 3 4 5;
    6 7 8 9 10];
xneg = [0.3 1 0.2 0.5 0.3;
    0.3 0.2 0.3 1 0.5];
xpos = [1 0.4 0.3 0.2 0.3;
    0.4 0.5 0.2 0.4 1];
errorbar(x,y,[],[],xneg,xpos)
xlim([-0.5 5.5])
ylim([0.5 10.5]) |
The data type of the error bar lengths must be compatible with the corresponding plot data. For example, if you plot datetime values, the error bars for those values must be duration values.
Data Types: single | double | int8 | int16 | int32 | int64 | uint8 | uint16 | uint32 | uint64 | logical | duration
Error bar orientation, specified as one of these values:
"vertical"— Vertical error bars"horizontal"— Horizontal error bars"both"— Vertical and horizontal error bars
Example: errorbar(x,y,err,"horizontal")
Line style, marker, and color, specified as a string scalar or character vector containing symbols. The symbols can appear in any order. You do not need to specify all three characteristics (line style, marker, and color). For example, if you omit the line style and specify the marker, then the plot shows only the marker and no line.
Example: "--or" is a red dashed line with circle markers.
| Line Style | Description | Resulting Line |
|---|---|---|
"-" | Solid line |
|
"--" | Dashed line |
|
":" | Dotted line |
|
"-." | Dash-dotted line |
|
| Marker | Description | Resulting Marker |
|---|---|---|
"o" | Circle |
|
"+" | Plus sign |
|
"*" | Asterisk |
|
"." | Point |
|
"x" | Cross |
|
"_" | Horizontal line |
|
"|" | Vertical line |
|
"square" | Square |
|
"diamond" | Diamond |
|
"^" | Upward-pointing triangle |
|
"v" | Downward-pointing triangle |
|
">" | Right-pointing triangle |
|
"<" | Left-pointing triangle |
|
"pentagram" | Pentagram |
|
"hexagram" | Hexagram |
|
| Color Name | Short Name | RGB Triplet | Appearance |
|---|---|---|---|
"red" | "r" | [1 0 0] |
|
"green" | "g" | [0 1 0] |
|
"blue" | "b" | [0 0 1] |
|
"cyan"
| "c" | [0 1 1] |
|
"magenta" | "m" | [1 0 1] |
|
"yellow" | "y" | [1 1 0] |
|
"black" | "k" | [0 0 0] |
|
"white" | "w" | [1 1 1] |
|
Axes object. If you do not specify the axes, then errorbar plots
into the current axes.
Name-Value Arguments
More About
errorbar accepts combinations of vectors
and matrices for plotting multiple sets of coordinates in the same axes.
Specify a vector and a matrix when the coordinates in one dimension are shared. The length of the vector must match one of the dimensions of the matrix. The rows (or columns) of the matrix are plotted against the vector. For example, you can specify the x-coordinates as an m-element vector and the y-coordinates as an m-by-n matrix. MATLAB displays n plots in the same axes that share the same x-coordinates.
Specify two matrices when the coordinates are different among all the plots in both dimensions. Both matrices must have the same size and orientation. The columns of the matrices are plotted against each other.