plot
Description
Add-On Required: This feature requires the MATLAB Support Package for Quantum Computing add-on.
plot(
specifies options using one or more name-value arguments. For example,
c,Name=Value)plot(c,QubitBlocks=[5 3]) separates blocks of 5 and 3 qubits with a red
dashed line in the plot.
plot( plots into the
specified parent container instead of the current container. The argument
parent,___)parent can precede any of the input argument combinations in the
previous syntaxes.
p = plot(___)QuantumCircuitChart object. Use this object to inspect and modify the
properties of the plotted circuit. For a list of properties, see QuantumCircuitChart Properties.
Examples
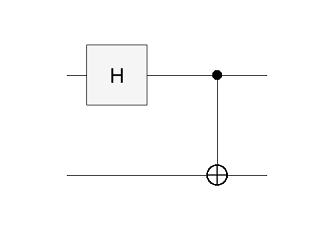
Create a quantum circuit that consists of a Hadamard gate and a controlled X gate to entangle two qubits.
gates = [hGate(1); cxGate(1,2)];
c = quantumCircuit(gates);
Plot the circuit.
plot(c)
Create a quantum circuit that consists of four controlled controlled X (CCX) gates.
gates = ccxGate([1 3 4 5],[2 6 7 8],[6 7 8 9]);
c = quantumCircuit(gates);
Plot the circuit with lines separating the qubit blocks. The qubit blocks to be separated are the first 5 qubits, followed by the next 3 qubits, and the last 1 qubit. The first 5 qubits are the first control qubits of each of the four CCX gates as well as the second control qubit of the first gate. The next 3 qubits are the second control qubits of the rest of the CCX gates. And the last 1 qubit is the final target qubit that holds the result of applying the last CCX gate.
plot(c,QubitBlocks=[5 3 1])

Create an array of inner gates consisting of a Hadamard gate and a controlled X gate to entangle two qubits.
gates = [hGate(1); cxGate(1,2)];
Construct two composite gates from the array of inner gates. Name the two composite
gates as "bell". The first composite gate acts on qubits 1 and 3 of
the outer circuit containing this gate. The second composite gate acts on qubits 2 and 4
of the outer circuit containing this gate.
cg1 = compositeGate(gates,[1 3],Name="bell");
cg2 = compositeGate(gates,[2 4],Name="bell");
Create a quantum circuit that contains these two composite gates.
circuit = quantumCircuit([cg1; cg2])
circuit =

  quantumCircuit with properties:

    NumQubits: 4
        Gates: [2×1 quantum.gate.CompositeGate]
         Name: ""
Plot the circuit.
plot(circuit)

In a circuit diagram, each solid horizontal line represents a qubit. The top line is a qubit with index 1 and the remaining lines from top to bottom are labeled sequentially. In this example, the plotted circuit consists of four qubits with indices 1, 2, 3, and 4. The plot shows that qubits 1 and 3 of the circuit are mapped to qubits 1 and 2 of the inner gates of the first composite gate, and qubits 2 and 4 of the circuit are mapped to qubits 1 and 2 of the inner gates of the second composite gate.
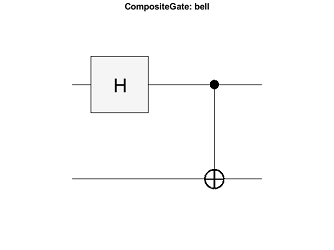
Click one of the composite gate blocks in the plot. A new figure showing the internal gates of the composite gate appears.
Create and plot a quantum circuit that consists of a Hadamard gate
and a controlled X gate to entangle two qubits. Return the
QuantumCircuitChart object by specifying an output argument to
plot.
gates = [hGate(1); cxGate(1,2)];
c = quantumCircuit(gates);
p = plot(c);
Display qubit labels on the left by modifying properties of the chart object.
p.QubitLabelLocation = "left";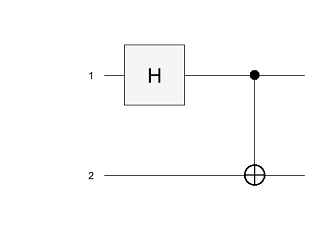
Input Arguments
Name-Value Arguments
Tips
On a plotted quantum circuit or composite gate, you can move your mouse over the gate symbols (on the corners of the box symbol or on the markers of the gate symbol) to show additional information about the individual gates. This information includes the gate name, the gate index in the circuit, and the specified angle for the gate operation.
You can click on a plotted composite gate to open a new figure with the internal gates of the composite gate.