show
Description
Examples
Load data for states and links.
load navGraphData.matCreate state and link tables.
stateTable = table(data.states,data.names,data.numLanes, ...
    VariableNames=["StateVector","Name","Lanes"]);
linkTable = table(data.links,data.linkWt,data.curvature, ...
    VariableNames=["EndStates","Weight","Curvature"]);
Create a navGraph object from the state and link tables.
graphObj = navGraph(stateTable,linkTable);
Create a deep copy of the navGraph object.
graph2 = copy(graphObj)
graph2 =
  navGraph with properties:

           States: [8×3 table]
            Links: [7×3 table]
    LinkWeightFcn: @nav.algs.distanceEuclidean
Visualize the navGraph object.
show(graphObj)
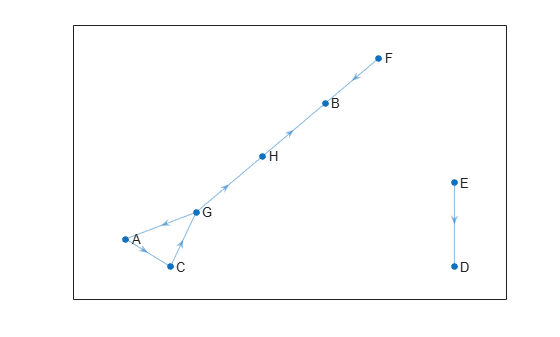
Find the link IDs of two state pairs. The function returns the link ID for the state pair ["G","A"]. However, it returns 0 as the link ID for the state pair ["C","D"] as the link does not exist in the navGraph object.
linkIDS = findlink(navGraphObj,["G","A"; "C","D"])
linkIDS = 2×1

     5
     0
Input Arguments
Output Arguments
Version History
Introduced in R2023a
See Also
Objects
Functions
findlink|findstate|index2state|state2index|successors|copy|addstate|addlink|rmstate|rmlink