Log and Plot Simulation Data
This example shows how you can log and plot simulation data instead of adding sensors to your model. This example uses command-line functions, suited for scripting and batch processing. For an interactive example that uses the Simscape™ Results Explorer to plot logged simulation data, see Log, Navigate, and Plot Simulation Data.
The model shown represents a permanent magnet DC motor.
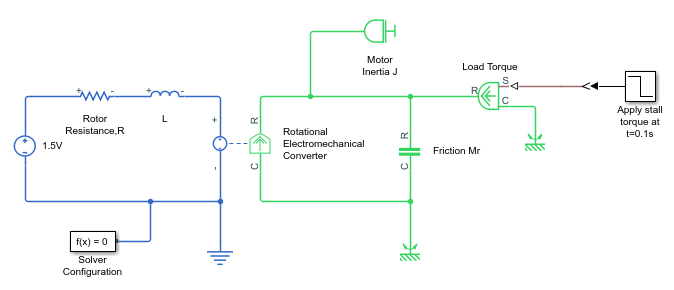
This model is very similar to the Permanent Magnet DC Motor example, but, unlike the example model, it
does not include the Sensing unit w (Ideal Rotational Motion
Sensor and PS-Simulink Converter block) along
with the Motor RPM scope. For a detailed description of the Permanent Magnet DC Motor example,
see Evaluating Performance of a DC Motor.
Build the model, as shown in the preceding illustration.
In the model window, open the Modeling tab and click Model Settings. The Configuration Parameters dialog box opens.
In the Configuration Parameters dialog box, in the left pane, select Data Import/Export. Clear the Single simulation output check box, which is selected by default. This step enables associating the logged simulation data with a separate workspace variable, instead of it being part of the single output object.
To enable data logging, in the Configuration Parameters dialog box, in the left pane, select Simscape, then set the Log simulation data parameter to
Alland click OK.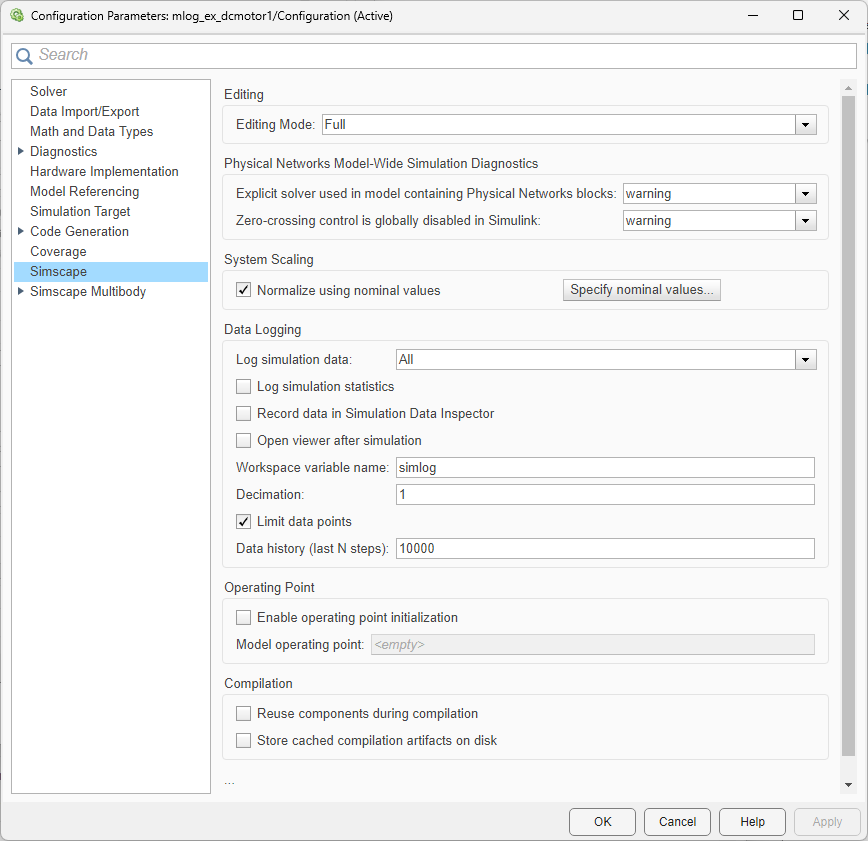
Simulate the model. This creates a workspace variable named
simlog(as specified by the Workspace variable name parameter), which contains the simulation data.The
simlogvariable has the same hierarchy as the model. To see the whole variable structure, at the command prompt, type:print(simlog)
This command prints the whole data tree.
     mlog_ex_dcmotor1
     +-Electrical_Reference2
     | +-V
     |   +-v
     +-Friction_Mr
     | +-C
     | | +-w
     | +-R
     | | +-w
     | +-t
     | +-w
     +-L
     | +-i
     | +-i_L
     | +-n
     | | +-v
     | +-p
     | | +-v
     | +-v
     +-Load_Torque
     | +-C
     | | +-w
     | +-R
     | | +-w
     | +-S
     | +-t
     | +-w
     +-Mechanical_Rotational_Reference
     | +-W
     |   +-w
     +-Mechanical_Rotational_Reference1
     | +-W
     |   +-w
     +-Motor_Inertia_J
     | +-I
     | | +-w
     | +-t
     | +-w
     +-Rotational_Electromechanical_Converter
     | +-C
     | | +-w
     | +-R
     | | +-w
     | +-i
     | +-n
     | | +-v
     | +-p
     | | +-v
     | +-t
     | +-v
     | +-w
     +-Rotor_ResistanceR
     | +-i
     | +-n
     | | +-v
     | +-p
     | | +-v
     | +-v
     +-x1_5V
       +-i
       +-n
       | +-v
       +-p
       | +-v
       +-v
Every node that represents an Across, Through, or internal block variable contains series data. To get to the series, you have to specify the complete path to it through the tree, starting with the top-level variable name. For example, to get a handle on the series representing the angular velocity of the motor, type:
s1 = simlog.Rotational_Electromechanical_Converter.R.w.series;
From here, you can access the values and time vectors for the series and analyze them.
You do not have to isolate series data to plot its values against time, or against another series. For example, to see how the motor speed (in revolutions per minute) changes with time, type:
plot(simlog.Rotational_Electromechanical_Converter.R.w,'units','rpm')
Compare this figure to the RPM scope display in the Permanent Magnet DC Motor example. The results are exactly the same.
To plot the motor torque against its angular velocity, in
rpm, and add descriptive axis names, type:plotxy(simlog.Rotational_Electromechanical_Converter.R.w,simlog.Motor_Inertia_J.t,... 'xunit','rpm','xname','Angular velocity','yname','Torque')
For more information on plotting logged simulation data, see the
simscape.logging.plotandsimscape.logging.plotxyreference pages.