Work with Basic Signal Data
Create Signals and Signal Data
In the Signal Editor tab, create signal data either from existing model
data (scenarios) or start with an empty scenario. By default, Signal Editor creates data
in timeseries format. To a scenario, add signals and data by:
Adding basic signals or waveforms to Signal Editor (Insert Signals).
Adding signal data directly into a table (Work with Basic Signal Data).
Authoring signal data using signal notations and variables (Create Signals with MATLAB Expressions and Variables).
Drawing signal points and lines (Create Freehand Signal Data Using Mouse or Multi-Touch Gestures).
After inserting the signal, view, plot, and edit the data by double-clicking
![]() . The plot opens.
. The plot opens.
If the data does not plot as expected, use the Fit to window button in the Zoom & Pan section. For multidimensional signals, also make sure that you have the right plot selected for the column data you are editing.
Explore the plots using the Measure and Zoom & Pan sections on the toolbar.
In the Measure section, use the Data Cursors button to display one or two cursors for the plot. These cursors display the T and Y values of a data point in the plot. To view a data point, click a point on the plot line.
In the Zoom & Pan section, select how you want to zoom and pan the signal plots. Zooming is only for the selected axis.
Work with Basic Signal Data
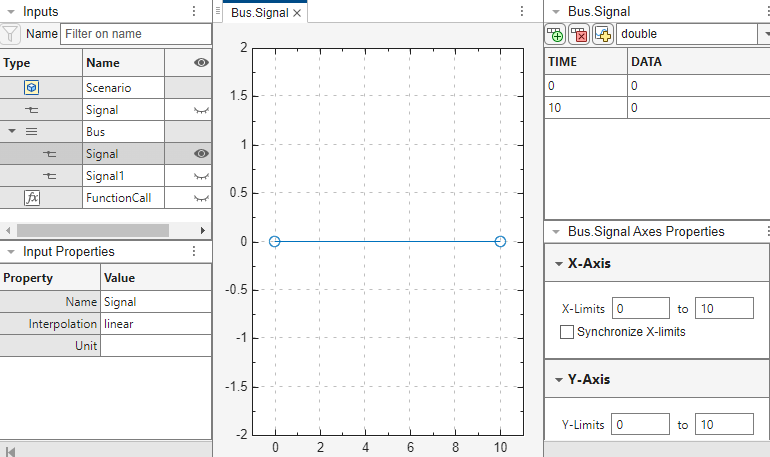
To add and edit basic signal data, select a signal and double-click the associated ![]() . The Edit tab opens with a plot
of the signal. Each data point in the signal is demarcated with a circle (marker), which
you can toggle off and on through the context menu Show > Toggle Markers option. Each signal has a tabular data editor.
. The Edit tab opens with a plot
of the signal. Each data point in the signal is demarcated with a circle (marker), which
you can toggle off and on through the context menu Show > Toggle Markers option. Each signal has a tabular data editor.
To insert or delete a data row for a signal, use
 or
or  , respectively.
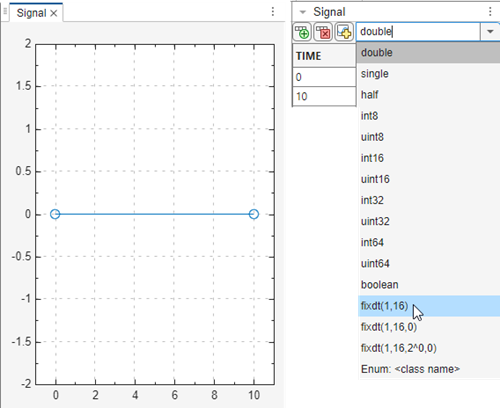
To change the data type for signal data, select the type from the list.
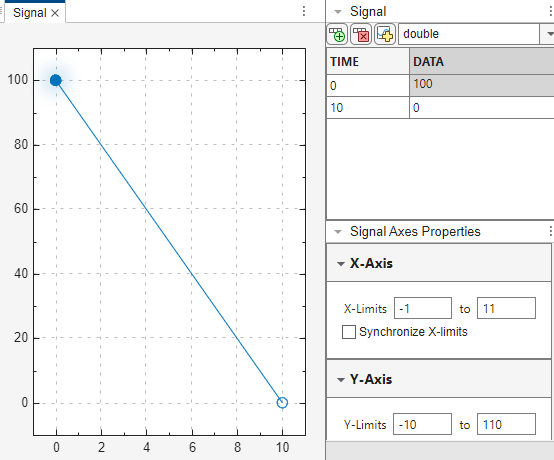
To change the time or data for each signal, edit the associated column of the data row, then click anywhere in the canvas to update the plot of the signal. You may need to click Fit to View in the toolstrip to adjust the plot axes.
Note
If the data is fixed-point data, pausing on the data in the table displays a summary of the data
Ideal Value — Requested value
Fixed-Point Value — Value resulting from casting the ideal value as a fixed-point value
Absolute Error — Absolute error of value
Relative Error — Difference between cast value and the original value
Additional error information, such as whether the error is an overflow or underflow
To change the size of a section in Signal Editor, drag the separator.
To evaluate MATLAB® expressions in table cells, type the expressions in a table cell:
The expression must be a valid MATLAB syntax.
The result of the syntax must be a scalar value.
The result of the syntax must a valid value based on the signal properties such as data type and complexity.
Expressions can access variables in the base workspace. If an expression does not satisfy these guidelines, Simulink® software reverts the cell entry to the original value. When you start the Signal Editor interface launched from a Signal Editor block, expressions can contain variables from the model workspace or data dictionary. When you start the Signal Editor interface separately from the block, you must provide the model parameter to access variables from the model workspace, data dictionary, or MAT files that are attached to the model.
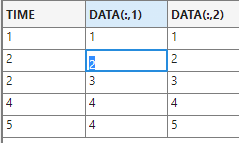
To create multidimensional signals, use one of these methods. For more information, see Add and Edit Multidimensional Signals.
In the Default Properties for Insertion dialog box, enter a dimension greater than
1in the Dimensions parameter.In the Author and Insert dialog box, enter a MATLAB expression that creates multidimensional signals in the Data parameter
You can navigate through the Signal Editor user interface data tabular area using the Tab and Shift+Tab keyboard shortcuts.
In the Signal Editor tabular area, enter the cell edit mode of the tabular area by using one of these options:
Double-click a table cell.
Pres the Enter key.
When cell edit mode is enabled, the resulting cell is white and outlined in blue.
To navigate forward through the table, press Tab.
To navigate backward through the table, press Shift+Tab.
Replace a signal with a waveform. In the Inputs hierarchy pane, right-click on the signal you want to replace, select
Replace
                        signal data with
from the context menu, and select one of these waveforms.ConstantStepPulseMATLAB expression, which starts the Author and Replace Signal Data dialog box.

Copy and paste signal data.
To copy all signal information, including name, properties and data, in the Inputs hierarchy pane, right-click on the signal and select
Copyand then paste in another area of the Inputs hierarchy pane. In the hierarchy pane, you can paste to the same scenario, a different scenario, or outside a scenario.
To copy signal data and time only, in the signal pane, copy the signal and data from the table and paste it into another row and/or column of the signal pane. The size of the pasted data and signal must match the size of the copied signal and data.
To replace all signal data with the contents of the clipboard, copy signal data from another source, such as a Microsoft® Excel® spreadsheet or another Signal Editor signal data table, and then in the Signal page, right-click and select Replace signal data with > Clipboard data. Note:
Signal data table and clipboard data table must have the same number of columns.
The first column of the clipboard data table must be monotonically increasing.
The data type of the existing signal data must be able to cast to the clipboard data.
Instead of using the tabular editor to define signal data, you can use MATLAB expressions.