R2026b

New Features, Bug Fixes, Compatibility Considerations

 Review design structure, diagnostics, and reuse in the Model Design Dashboard

In R2026b, you can get a high-level overview of design quality by using the new Model Design Dashboard. The dashboard assesses design size, complexity, requirements traceability, diagnostics, and reuse so that you can identify areas for improvement.

Use the Model Design Dashboard to:

  • Assess the size and composition of your design across Simulink®, Stateflow®, and MATLAB® code.

  • View complexity metrics, such as Halstead difficulty and cyclomatic complexity, and drill down to the Model Maintainability Dashboard for detailed architecture and decision path analysis.

  • Review requirements traceability, including implemented requirements, link types, and broken links.

  • Check recent compile results and code issues from the MATLAB Code Analyzer.

  • Identify opportunities for reuse through referenced models, linked libraries, subsystem references, and Clone Detector results.

To open the dashboard, on the Project tab, expand the Tools gallery, and select Model Design Dashboard. For more information, see Assess Model Design Using Model Design Dashboard.

Note

If you currently use the Metrics Dashboard to review MATLAB Code Analyzer warnings, Simulink diagnostics, and reuse metrics, consider using the new Model Design Dashboard instead. The Metrics Dashboard will be removed in a future release.
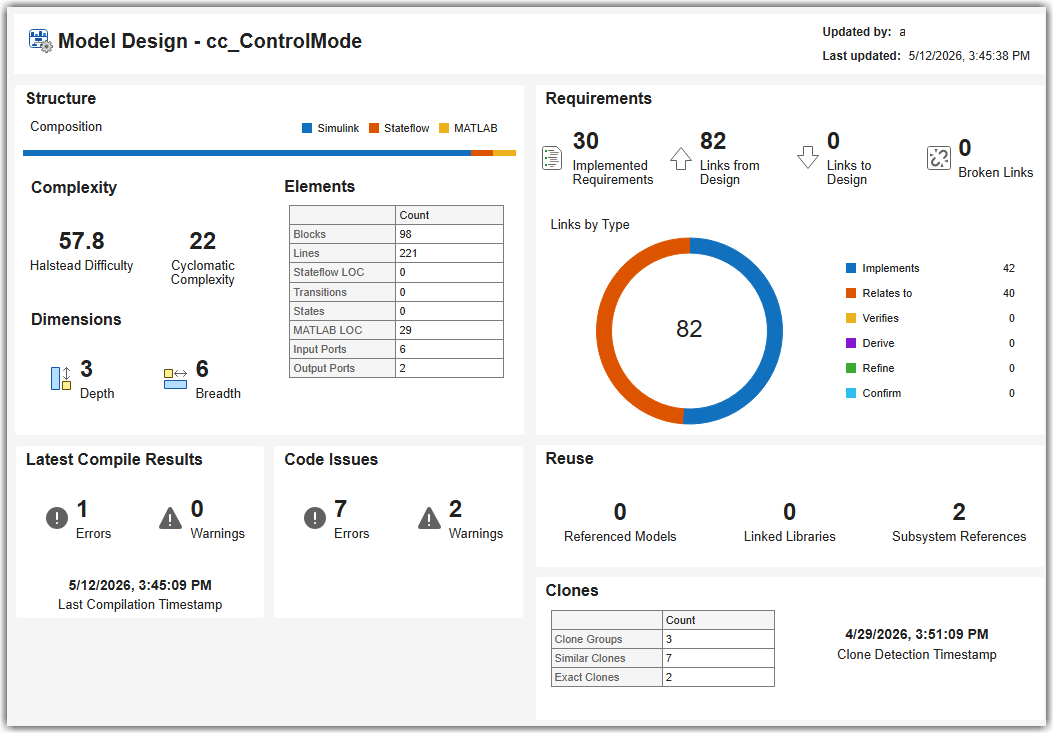
Model Design Dashboard showing structure, complexity, requirements, and issues for the cc_ControlMode model

Exclude files and folders from the digital thread

Starting in R2026b, you can control which files and folders are included in the digital thread by defining ignore rules in the matlab.toml file for projects that use the new TOML metadata format. In the TOML file, add a new section, [project.digital-thread], and use glob patterns to specify files and folders to ignore. This feature requires a TOML-based project. Adding a matlab.toml file to a project that uses the older .prj format does not enable digital thread exclusions.

This example TOML code specifies that the digital thread must ignore a specific folder, a specific MATLAB function file, and a folder of Simulink models.

[project.digital-thread]
ignore = ["myfolder", "myfunc.m", "duplicate_models/*.slx"]
By default, the digital thread also ignores source control folders, project resource folders, and other similar directories.

If your project does not use the TOML metadata format, you can alternatively define ignore rules in a digital-thread.toml file at the project root. In this file, use a top-level ignore key instead of the [project.digital-thread] section.

ignore = ["myfolder", "myfunc.m", "duplicate_models/*.slx"]

If your project contains both a matlab.toml file and a digital-thread.toml file, the rules in matlab.toml take precedence and digital-thread.toml is ignored.

For more information, see Exclude Files and Folders and MATLAB Projects TOML Format (.toml).

Customize shipping thresholds in the Model, SIL Code, and PIL Code Testing dashboards

Starting in R2026b, you can create custom threshold sets by copying and modifying a shipping threshold set. Use custom thresholds to tailor compliance criteria to your project requirements. Custom threshold sets appear in the threshold settings in the top-left corner of the Model, SIL Code, and PIL Code Testing dashboards, alongside the shipping threshold sets. To apply your customized thresholds, select the threshold set.
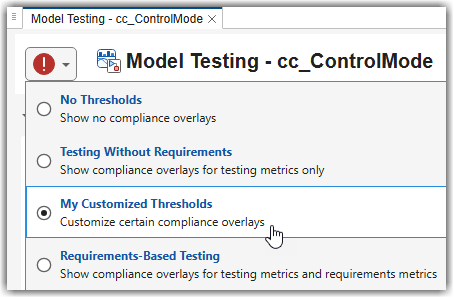
Dashboard threshold settings showing the customized threshold set

Additionally, you can use custom thresholds with the metric engine API. For example, you can get metric results classified according to a specific threshold set by using the ThresholdSetId argument in getMetrics function.

metricEngine = metric.Engine;
metricID = "modeltesting.TestResultAnalysis[slcomp.TestStatusDistribution]";
results = getMetrics(metricEngine,metricID,ThresholdSetId="MyCustomizedThresholds")

For more information, see Adjust Dashboard Thresholds to Match Your Testing Criteria.

Coverage metrics for model, SIL, and PIL testing return test result contributions and coverage outcomes

In R2026b, metric results for model, software-in-the-loop (SIL), and processor-in-the-loop (PIL) test coverage now return additional fields that identify the test results that contribute to the reported coverage and the number of coverage outcomes. You can use these new fields to help analyze and trace coverage results programmatically.

Before R2026bR2026b and Later Releases

The metric result value includes only fields related to coverage. For example:

resultValue = 

  struct with fields:

             Execution: [1×1 struct]
              Decision: [1×1 struct]
             Condition: [1×1 struct]
                  MCDC: [1×1 struct]
    OverflowSaturation: [1×1 struct]

The metric result value includes additional fields for test result artifacts (TestResults) and coverage outcomes (Fragments). For example:

resultValue = 

  struct with fields:

             Execution: [1×1 struct]
              Decision: [1×1 struct]
             Condition: [1×1 struct]
                  MCDC: [1×1 struct]
    OverflowSaturation: [1×1 struct]
           TestResults: [1×1 struct]
             Fragments: [1×1 struct]

The coverage results do not return coverage outcomes. For example:

coverage = 

  struct with fields:

               Achieved: 70
              Justified: 20
                 Missed: 10
    AchievedOrJustified: 90

The coverage results return the number of satisfied, justified, and total coverage outcomes. For example:

coverage = 

  struct with fields:

               Achieved: 70
              Justified: 20
                 Missed: 10
    AchievedOrJustified: 90
      SatisfiedOutcomes: 7
      JustifiedOutcomes: 2
          TotalOutcomes: 10

For more information, see:

Additionally, the coverage bar chart widgets in the Model Testing, SIL Code Testing, and PIL Code Testing dashboards include an Open in Test Manager option in the widget context menu. Use this option to view the aggregated coverage results in the Simulink Test Manager.

Identify artifacts in metric results using digital thread URIs

Starting in R2026b, metric results return digital thread URIs as unique, portable identifiers for artifacts. You can convert between these URIs and actual objects in your design, such as Simulink models, model elements, requirements, and tests.

Use the digital thread storage map (digitalthread.StorageMap.forProject) and these functions to convert between digital thread URIs and objects:

Note

Do not parse digital thread URIs manually. The internal structure of URIs, especially element addresses, is subject to change in future releases. Always use the conversion functions listed above.

Scope metric execution and results to specific artifacts using digital thread URIs

In R2026b, you can scope metric execution and results to a specific artifact by using the new ScopeId argument in the execute and getMetrics functions. When you specify a digital thread URI for the artifact, the metric engine collects or returns results for only that artifact. For example, to return only the metric results for a subsystem that you selected in the Simulink canvas:

storageMap = digitalthread.StorageMap.forProject();
subsystemURI = digitalthread.uri.simulink.fromObject(storageMap,get_param(gcb,"Handle"));
metricID = "sldesignlayer.SimulinkDesignInfo";
results = execute(metricEngine,metricID,ScopeId=subsystemURI)

The ScopeId argument is recommended over the ArtifactScope argument for the execute and getMetrics functions.

Note

For table metrics (metrics that use the bracket notation, such as "modeldesign.SimulinkMaintainability[slcomp.BlockDistribution]"), specifying ScopeId limits the collection of dependent metrics only. The table metric itself still collects results across all scopes.

Additionally, you can limit report content to a specific unit or component model by using the ScopeId argument in generateReport.

New combined design metrics for MATLAB, Simulink, and Stateflow domains

Starting in R2026b, new metrics summarize key design and complexity measurements for Simulink, Stateflow, and MATLAB artifacts in a single metric for each domain. These metrics combine design information that was previously available only through multiple individual metrics, now making it easier to access key metric results for each domain.

The new metrics are:

For example, the MATLAB design information metric provides information on MATLAB functions, class methods, and Stateflow embedded MATLAB functions. The metric combines multiple code quality metrics into one metric result, including the number of decisions, executable lines of code, and input and output arguments. The metric also returns Halstead complexity metrics like volume and difficulty.

You can execute the metrics programmatically by using the metric engine:

E = metric.Engine;
slResults = E.execute("sldesignlayer.SimulinkDesignInfo")
sfResults = E.execute("sfdesignlayer.StateflowDesignInfo")
mlResults = E.execute("mldesignlayer.MATLABDesignInfo")

Assess component structure and complexity with new model maintainability metric

Starting in R2026b, you can assess the structural complexity of software components by using the new component structure metric slcomp.ComponentStructure.

The metric analyzes the hierarchy inside a component and provides information about the hierarchy size, depth, and branching. You can use the metric to help identify components that are too deeply nested, too flat, or unbalanced. These characteristics can make a component more difficult to understand, modify, and maintain.

For more information, see Component Structure.

Advisor.Config: Access and configure display name and severity of Model Advisor checks programmatically

Use these new functions with the Advisor.Config object to get and set the display name and severity of a Model Advisor check.

FunctionDescription
getDisplayNameGet check display name
setDisplayNameSet check display name
getSeverityGet check severity level
setSeveritySet check severity level

View MAB check results in a structured format

Starting in R2026b, 16 existing MAB checks display results in an updated, structured format in Model Advisor. This update improves how you review and interpret check results while preserving the existing check behavior and outcomes.

With this update, you can:

  • View check results in a structured format instead of a flat text-based layout.

  • See individual findings with consistent information, such as status and recommended action.

  • Navigate results more easily using the default Model Advisor result presentation.

The updated result format uses the standard Model Advisor result presentation for checks authored with detailed result collections. For more information, see ModelAdvisor.ResultDetail and setCallbackFcn.

In the updated Model Advisor Report view, the check status appears as a horizontal summary bar.
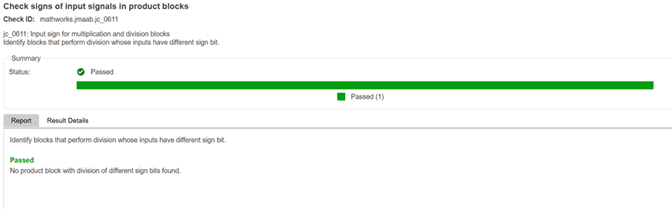
Updated Model Advisor report view showing a check with a Passed status and a horizontal summary bar labeled Passed (1). Results are displayed as text with improved visual organization.

In the updated Model Advisor Result Details view, check results appear in a table with columns for status, failing element, description, recommended action, justifications, and the check status appears as a horizontal summary bar.
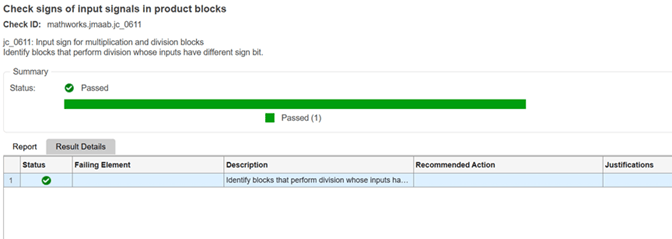
Updated Model Advisor Result Details view showing check results in a table with columns for status, failing element, description, recommended action, and justifications. A single row indicates the check passed.

The following table lists the MAB checks that use the updated result format in this release.

If you previously justified these checks, review the justifications after upgrading. The updated result format can affect how individual results are displayed.

Verify Simulink and Stateflow models against MISRA SLSF 2023 modeling standards

Starting in R2026b, you can assess compliance of Simulink and Stateflow models with MISRA SLSF 2023 modeling standards by running checks in Model Advisor under By Task > MISRA Compliance > Modeling Standards for MISRA SLSF. These checks evaluate key modeling aspects, including model configuration, data typing, signal routing, block usage, execution order, graphical layout, and Stateflow chart structure. Each check maps to a specific MISRA SLSF 2023 rule and references the corresponding MathWorks Advisory Board (MAB) guidelines, Version 5.0. For more information, see Model Advisor Checks for MISRA SLSF Modeling Standards and Control Algorithm Modeling Guidelines Using MATLAB, Simulink, and Stateflow.

Verify requirement links by using reorganized High-Integrity System Modeling checks and guidelines

Starting in R2026b, the high-integrity system modeling check Check for components that are not linked to requirements (Check ID: mathworks.hism.hisl_0070) is reorganized into multiple targeted checks, each addressing a specific requirement‑linking condition in the model.

Similarly, the corresponding modeling guidelines are reorganized and split into more targeted guidelines to align with the refined checks. Requirement-linking verification for other domains is now covered by these checks and guidelines:

Model Advisor CheckModeling GuidelineCheck IDScope
Check for requirement granularity in a modelhisl_0080: Establish requirement granularity in a modelmathworks.hism.hisl_0080Requirement granularity in Simulink model components
Check for architecture components without requirement linkshisc_0001: Placement of requirement links in an architecture modelmathworks.hism.hisc_0001Architecture components in System Composer™
Check for requirement granularity in an architecture modelhisc_0002: Establish requirement granularity in an architecture modelmathworks.hism.hisc_0002Requirement granularity in System Composer architecture model components

Verify additional configuration parameters for MISRA C:2023 compliance

The check Check configuration parameters for MISRA C:2023 (Check ID: mathworks.misra.CodeGenSettings) now verifies a broader range of configuration parameters that impact MISRA C:2023 compliance of generated code and simulation behavior. The newly introduced parameter settings are:

Code Generation > Interface

Configuration ParameterDescription
Language (Simulink Coder)Specifies whether the code generator produces C or C++ code.
Remove error status field in real-time model data structure (Embedded Coder)Specifies whether to log error status data in the real-time model data structure.
Generate C API for: signals (Simulink Coder)Specifies whether, for model signals, the code generator produces C API data interface code in a signal structure.

Generate C API for: parameters (Simulink Coder)

Specifies whether, for model tunable parameters, the code generator produces C API data interface code in a parameter structure.
Generate C API for: states (Simulink Coder)Specifies whether, for model states, the code generator produces C API data interface code in a state structure.

Generate C API for: root-level I/O (Simulink Coder)

Specifies whether, for model root-level inports and outports, the code generator produces C API data interface code in a root-level I/O structure.

Simulation Target

Configuration ParameterDescription
Block reductionSpecifies whether to reduce execution time by optimizing the block diagram to reduce the number of blocks in the model that execute during simulation.

Similarly, the corresponding modeling guideline hisl_0060: Configuration parameters that improve MISRA C compliance is updated to reflect the expanded scope of the check, maintaining consistent guidance between the check behavior and the documented MISRA C:2023 configuration recommendations.

 Updated MAB and JMAAB Modeling checks

Starting in R2026b, these checks are modified:

Model Advisor CheckCheck IDNew or Modified Functionality
Check the display attributes of block namesmathworks.maab.jc_0061Use the Fix button in Model Advisor to automatically resolve violations identified by the check.
Check Output data type of operation blocksmathworks.jmaab_v6.jc_0651Use the Fix button in Model Advisor to automatically resolve violations identified by the check.
Check usage of Sum blocksmathworks.jmaab.jc_0121Use the Fix button in Model Advisor to automatically resolve violations identified by the check.
Check for mixing basic blocks and subsystemsmathworks.maab.db_0143The Standard input parameter is no longer supported for this check.
Check for prohibited sink blocksmathworks.maab.hd_0001The Standard input parameter is no longer supported for this check.
Check signal line labelsmathworks.maab.na_0008The Standard input parameter is no longer supported for this check.

Verify MISRA C compliance of generated code using Polyspace analysis

Starting in R2026b, two new Model Advisor checks are introduced to help you verify MISRA C compliance of generated code by running a Polyspace® analysis directly from Model Advisor.

Model Advisor CheckCheck ID
Check MISRA C2012 compliance on Generated Codemathworks.misra.checkPolyspaceMISRA2012Compliance
Check MISRA C2023 compliance on Generated Codemathworks.misra.checkPolyspaceMISRA2023Compliance

These checks report Mandatory and Required MISRA C rule violations found by the Polyspace analysis. The results include mappings to lines of code where violations occur and, when available, to the associated blocks in the Simulink model to help you trace issues back to the model.

Detect lookup table usage issues with new Early Detection check

Starting in R2026b, you can use the early detection check Check usage of Lookup Table blocks (Check ID: mathworks.earlydetection.LookUpTableUsage) to identify potential issues related to the lookup table block usage while editing your model. This check detects configuration settings and usage patterns that may affect simulation behavior or generated code, enabling you to address concerns earlier in the model development workflow.

New GitHub repository for platform engineers

A new GitHub® repository for platform engineers shows how to integrate MATLAB and Simulink workflows into CI/CD pipelines.

For more information, see Integrate MATLAB and Simulink into CI/CD Pipelines in GitHub.

 CI/CD Automation for Simulink Check (September 2026)

With the support package, you can now run tasks on projects that use the new matlab.toml definition file type. For more information about the new TOML metadata format for projects, see MATLAB Projects TOML Format (.toml).

 Compatibility Considerations

Starting in R2026b, the digital thread uses a release-specific file, digital_thread_project_releaseName.db, instead of artifacts.dmr.

For example, in R2026b, the digital thread file is:

digital_thread_project_26b.db
If you have scripts that reference artifacts.dmr, you must update your code. For more information, see Digital thread creates release-specific databases.

 Functionality being removed or changed

Model Advisor metric checks will be removed

The Model Advisor checks in By Task > Model Metrics will be removed in a future release. These checks depend on the slmetric API, which will be removed along with the Metrics Dashboard.

The affected checks have Model Advisor check IDs that start with mathworks.metricchecks, such as mathworks.metricchecks.SimulinkBlockCount.

To assess model size, architecture, and complexity, use the Model Maintainability Dashboard and the new Model Design Dashboard instead.

New metric ID naming convention for metric engine API

Behavior change

Starting in R2026b, the metric IDs that you use in the metric engine API follow a new naming convention. The new metric IDs indicate both the metric domain and the context in which you use the metric, such as model design, model testing, SIL, or PIL.

For example, the metric ID "slcomp.BlocksDistribution" is now "modeldesign.SimulinkMaintainability[slcomp.BlockDistribution]". Metrics that use this bracket notation are called table metrics. Specify an ID in brackets to collect one field, or use only the table name to collect all fields.

The previous metric IDs continue to work but are not recommended for new code. For specific metric ID mappings, see:

If your code uses hard-coded metric ID strings, you can simplify updates by getting the available metric IDs programmatically using the getAvailableMetricIds function:

metricEngine = metric.Engine();
metricIDs = getAvailableMetricIds(metricEngine,App="DashboardApp",Dashboard=dashboardIdentifier)
Specify dashboardIdentifier based on the type of metrics you need:

  • "ModelUnitDesign" — Returns model design metric IDs.

  • "ModelMaintainability" — Returns model maintainability metric IDs.

  • "ModelUnitTesting" — Returns model testing metric IDs.

  • "ModelUnitSILTesting" — Returns software-in-the-loop (SIL) code testing metric IDs.

  • "ModelUnitPILTesting" — Returns processor-in-the-loop (PIL) code testing metric IDs.

Digital thread creates release-specific databases

Starting in R2026b, the digital thread stores data in release-specific database files, rather than a single artifacts.dmr or resultservice.dmr file. You no longer need to rebuild the digital thread database each time you switch between MATLAB releases. The digital thread automatically uses the database for the current release, if one exists.

For each MATLAB release, the digital thread creates separate database files in the derived folder:

Previous ReleasesStarting in R2026b

artifacts.dmr

digital_thread_project_releaseName.db

resultservice.dmr

metrics_project_releaseName.dmr

For example, in R2026b, the files are digital_thread_project_26b.db and metrics_project_26b.dmr.

If you have custom code or tooling that references artifacts.dmr and resultservice.dmr, update that code to use the new release-specific files instead.

Metric slcomp.ComponentInterfaceSignals returns the number of input and output signals using a structure with multiple fields

Starting in R2026b, the metric slcomp.ComponentInterfaceSignals returns the value of the metric result as a structure with named fields.

Before R2026bStarting in R2026b

The Value property in the metric result is a vector with two elements. The first element is the number of input signals and the second element is the number of output signals.

For example:

ans =

     6
     2

The Value property in the metric result is a structure with two fields, InputSignals and OutputSignals.

For example:

ans = 

  struct with fields:

     InputSignals: 6
    OutputSignals: 2

Update your code to use the new result structure. For more information, see Input and Output Component Interface Signals.

New Model Design Dashboard opens by default

In releases before R2026b, the Model Design Dashboard button on the Project tab and the modelDesignDashboard function open the Model Maintainability Dashboard.

Starting in R2026b, these functionalities open the Model Design Dashboard instead. You open the Model Maintainability Dashboard by opening the Model Design Dashboard and then selecting Model Maintainability from the dashboard gallery.

metric.Result Scope property replaced by ScopeId and ScopeAlias

Behavior change

Starting in R2026b, the Scope property of metric.Result objects has been removed. Use the new ScopeId and ScopeAlias properties instead:

  • ScopeId — Digital thread URI of the unit or component for which the metric collected results.

  • ScopeAlias — Display name of the unit or component.

If your code accesses the Scope property or its fields (UUID, Name, ParentUUID, ParentName), update the code to use ScopeId and ScopeAlias instead.

getArtifactIssues and getArtifactErrors return digital thread URI instead of Address and UUID

Behavior change

Starting in R2026b, the getArtifactIssues and getArtifactErrors functions return a URI field instead of the Address and UUID fields. The URI field contains the digital thread URI of the affected artifact.

If your code accesses the Address or UUID fields from the returned structure, update the code to use the URI field instead.

"Details" value for name-value argument DisplayResults in ModelAdvisor.run is removed

Errors

Starting in R2026b, the "Details" value for name-value argument DisplayResults is no longer supported in the ModelAdvisor.run function. Previously, this option displayed detailed check information in the Command Window. To review detailed results, use the Model Advisor interface, which provides structured results with status, description, and recommended action.

Model Advisor selection functions will be removed

Still runs

These Simulink.ModelAdvisor functions for selecting and deselecting tasks and checks will be removed in a future release.

R2026a

New Features, Bug Fixes, Compatibility Considerations

 Detect, visualize, and resolve modeling issues in the Model Guidance Dashboard

In R2026a, you can detect compliance issues while modeling and resolve them by using the Model Guidance Dashboard. The dashboard displays edit-time violations in the model, gives visual indications of violations, and displays live model metrics.

For more information, see Model Guidance Dashboard.
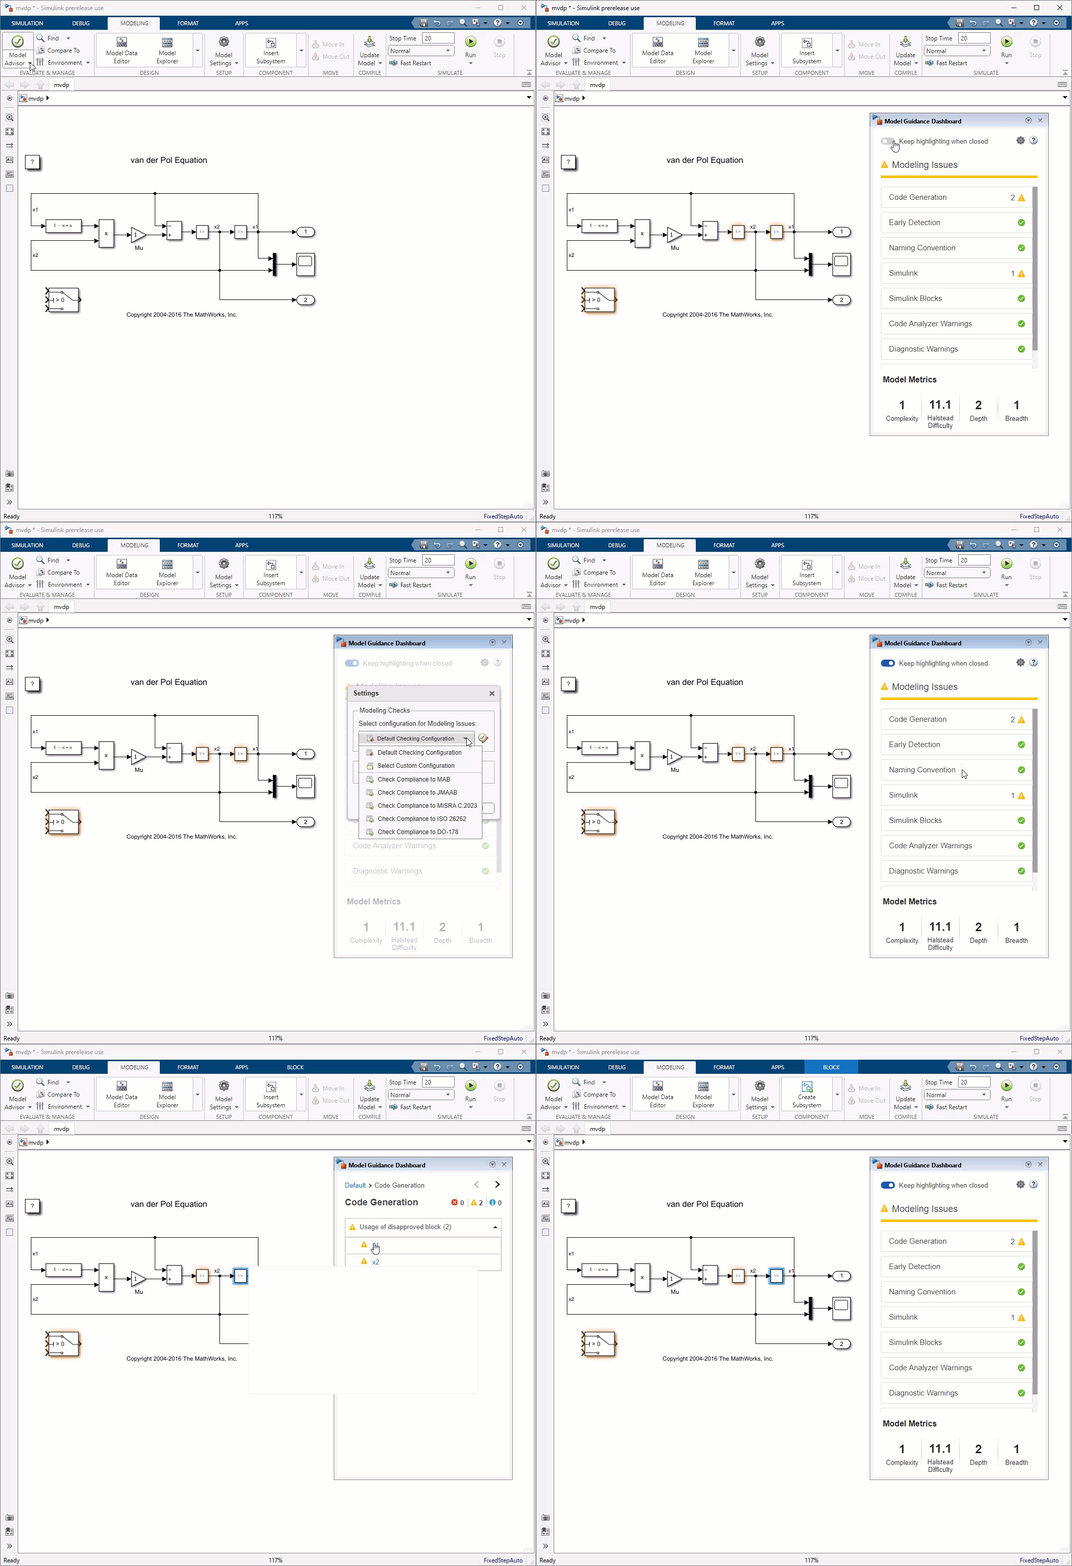
Model Guidance Dashboard

 Improved navigation and new metrics in the Project Model Testing dashboard

In R2026a, you can navigate directly to individual Model Testing, SIL Code Testing, and PIL Code Testing dashboards for each component model in your project by using the hyperlinks in the summary table at the bottom of the Project Model Testing dashboard.

The Project Model Testing dashboard also shows these new metric results:

  • Test Breakdown — View test cases in the project by type and tag.

  • Exported Test Results — View exported test result files in the project.

  • Artifact Issues — Monitor the number of errors, warnings, and informational messages that occur when the dashboard uses the digital thread to analyze artifacts in the project.

Additionally, to improve access to the project metrics, the Model Testing Dashboard button opens the Project Model Testing dashboard.

For more information, see Summarize Status of Testing for Project.

Hide compliance overlays for thresholds in the Model, SIL Code, and PIL Code Testing dashboards

Starting in R2026a, you can hide the compliance overlays in the Model, SIL Code, and PIL Code Testing dashboards by selecting a different threshold setting. The compliance overlays are the icons that show whether the metric results in a widget are compliant, non-compliant, have a warning, or are uncategorized. You can control which types of compliance overlays appear in the dashboard by selecting a threshold setting from the top-left corner of the dashboard.

The three available threshold settings are:

  • No Thresholds — The dashboard does not show compliance overlays.

  • Testing Without Requirements — The dashboard shows only compliance overlays for testing metrics.

  • Requirements-Based Testing — The dashboard shows compliance overlays for testing metrics and requirements metrics.

You can use the threshold settings to control which compliance overlays appear in the dashboard so that your dashboard does not appear non-compliant for metrics that are too strict or do not apply to your workflow.

For more information, see Explore Status and Quality of Testing Activities Using Model Testing Dashboard.

 Improved artifact scanning and indexing in Model Design and Model Testing Dashboards

Starting in R2026a, improvements in the digital thread allow the dashboards to scan and trace artifacts faster in R2026a. The digital thread now uses an Open Packaging Conventions (OPC) parser to efficiently scan Simulink models as well as Stateflow, System Composer, and Simulink Test™ artifacts. The dashboards no longer need to load these artifacts into memory, reducing analysis time.

 Compatibility Considerations

The dashboards no longer support:

  • SLX model files created before R2016a

  • MDL model files created before R2021b

Upgrade your models to a supported Simulink version.

Additionally, the digital thread:

  • No longer analyzes test result reports. These reports no longer appear in the Test Results folder in the Artifacts panel.

  • No longer caches trace information in models. The Cache trace information setting and TraceInfoCaching property have been removed from the digital thread settings.

 Content under self-modifiable masks contributes to dashboards and metric results

Starting in R2026a, the dashboards and metric results include metric results from block content under self-modifiable masks. In previous releases, the digital thread does not analyze the content of blocks under self-modifiable masks and, therefore, that content does not contribute to the dashboard and metric results.

 Compatibility Considerations

Models that use self-modifiable masks now report higher, but more accurate, metric result values for metrics like design cyclomatic complexity since the logic inside the content of those masked blocks is included in the number of decisions reported in the metric results.

execute function returns metric result object

Starting in R2026a, the execute function returns a metric result object when results exist. Prior releases require you to use the getMetrics function to get metric results from the metric engine.

Detect unsupported functions and verify system target file compliance with the enhanced TLC block interface using TLC checks

Use Model Advisor to check for unsupported functions in S-Function block TLC files and to check for compliance with the enhanced TLC block interface (Simulink Coder) in the system target file.

This table lists the two TLC checks introduced in R2026a to improve code generation.

Model Advisor CheckCheck ID
Check for unsupported TLC functions in S-function TLC files (Simulink Coder)mathworks.codegen.SFunctionTLCFileCompatibility
Check system target file compliance with enhanced TLC block interface (Simulink Coder)mathworks.codegen.TargetComplianceCheckForEnhancedInterface

Model Advisor issues warnings when it detects issues such as unsupported TLC functions and system target file noncompliance with the enhanced TLC block interface. The warnings help you identify issues early that can cause build errors and failures during code generation. The checks also provide actionable, specific recommendations. By using these recommendations, you can improve the efficiency, maintainability, and compatibility of generated code across Simulink versions.

Debug models using Model Slicer at breakpoints

Starting in R2026a, you can launch Model Slicer directly from the Breakpoints List when your Simulink model pauses at a breakpoint. This integration allows you to trace the signal values back to their sources so you can isolate the root cause of unexpected behavior in large models. A Simulink Check™ license is required to launch Model Slicer from the Breakpoints List.

In the Breakpoints List, Model Slicer:

  • Sets the starting point to the signal associated with the current breakpoint.

  • Updates the slice criteria to match the selected breakpoint when you add a new breakpoint or switch between existing breakpoints.

When model simulation hits a breakpoint, perform these steps to use Model Slicer from the Breakpoints List:

  1. On the Debug tab, click Breakpoints List. The Breakpoints List opens at the bottom of the Simulink Editor.

  2. In the Breakpoints List, click the Debug using Slicer button to debug the signal. You can also:

    • Add a starting point by clicking the Add Starting Point button .

    • View the upstream and downstream flow of the signals in the model using button.

  3. Click the Close Model Slicer button to close the Model Slicer.

For more information, see Breakpoints List (Simulink) and Trace Faulty Signal Paths Using Model Slicer at Signal Breakpoints.

 New context menu design for Model Slicer

Starting in R2026a, you can open the Model Slicer from the context menu by right-clicking the Simulink model canvas, model, subsystems, blocks, or signals. For example, this image shows the differences between the Model Slicer context menus that open when you right-click a subsystem in R2025b and in R2026a.
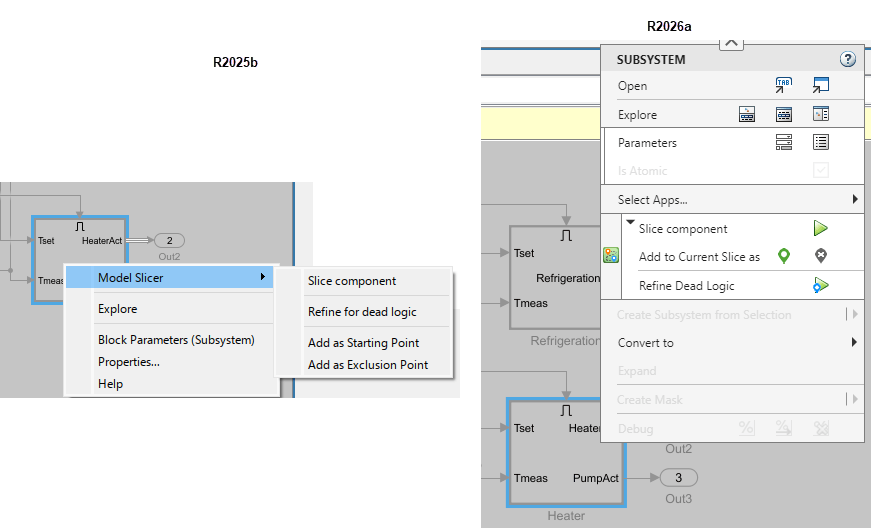
Context menus in R2025b and in R2026a.

To view the Model Slicer app section in the context menus, right-click the model canvas or subsystem, and select Model Slicer under Select Apps. The app opens and a Model Slicer app section appears in the context menu.

The Model Slicer context menu shows parameters with their corresponding icons for the model after you select Model Slicer app. The table shows the functionality in the context menu for model canvas, model, subsystems, blocks, or signals in R2026a that corresponds to options in the context menu in R2025b.

R2025bR2026a
Model Slicer > Slice componentRight-click the block or subsystem and select the Slice component button in the Model Slicer context menu.
Model Slicer > Refine for dead logicRight-click the block or subsystem and select the Refine for dead logic button in the Model Slicer context menu.
Model Slicer > Add as Starting PointRight-click the block or subsystem and select the Add to Current Slice as button in the Model Slicer context menu.
Model Slicer > Add as Exclusion PointRight-click the block or subsystem and select the Add as Exclusion Point button in the Model Slicer context menu.
Model Slicer > Enable editingRight-click the model canvas and select the Enable editing button in the Model Slicer context menu.
Model Slicer > Resume slicingRight-click the canvas and select the Resume slicing button in the Model Slicer context menu.
Model Slicer > ConstraintRight-click the block and select the Constraint button in the Model Slicer context menu.

To view a tooltip that explains what action you can take by clicking a button, hover over the button icon.
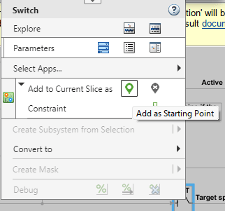
Model Slicer tooltip.

To remove the Model Slicer app section from the context menu, hover over the Model Slicer app icon and click Close App. For more information on the changes in the context menu, see Simulink Context Menu.

 New context menu design for Model Advisor

Starting in R2026a, you can open the Model Advisor from the context menu by right-clicking the Simulink model canvas, model, subsystems, blocks, or signals. For example, this image shows the differences between the Model Advisor context menus that open when you right-click a subsystem in R2025b and in R2026a.
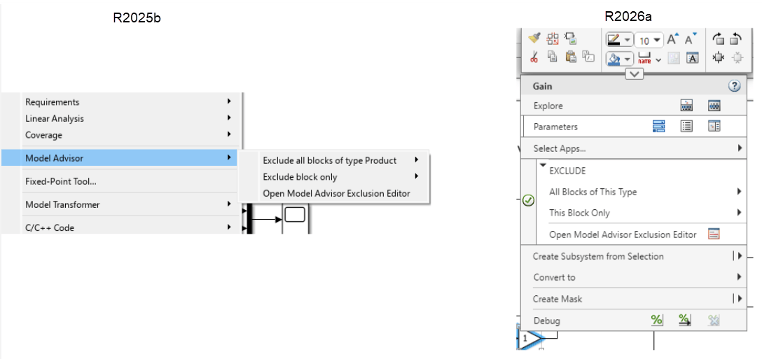
Simulink context menu showing Model Advisor options in R2025b and R2026a.

To view the Model Advisor apps section in the context menus, right-click the model canvas or subsystem, and select Model Advisor under Select Apps. The app opens and a Model Advisor app section appears in the context menu.

The table summarizes the actions in the context menu in R2026a for adding or modifying exclusions that correspond to actions the context menu in R2025b when you right-click the subsystem or block:

R2025bR2026a
Select Model Advisor > Model Advisor Exclusion EditorClick the block or subsystem and select Open Model Advisor Exclusion Editor button in the Model Advisor section of the context menu.
Select Model Advisor > Exclude all blocks of type blockType > All checksClick the block and select Exclude > All Blocks of This Type > All checks in the Model Advisor section of the context menu.
Select Model Advisor > Exclude all blocks of type blockType > Select checksClick the block and select Exclude > All Blocks of This Type > Select checks in the Model Advisor section of the context menu.
Select Model Advisor > Exclude block only > All checksClick the block and select Exclude > This Block Only > All checks in the Model Advisor section of the context menu.
Click the block and select Model Advisor > Exclude block only > Select checksClick the block and select Exclude > This Block Only > Select checks in the Model Advisor section of the context menu.

You can also open the Model Guidance Dashboard introduced in R2026a from the Model Advisor section of the context menu. To open it, right-click the model canvas, subsystem, or block and select the Open Model Guidance Dashboard button .

Simulink context menu showing the Model Advisor section and Model Guidance Dashboard option.

To remove the Model Advisor section from the context menu, hover over on the app icon and click Close App. For more information on the changes in the context menu, see Simulink Context Menu.

 Changes to Clone Detector and Model Transformer app context menu options

To access Clone Detector app options in the new Context Menu design, point to Select Apps and click the Clone Detector button . A new menu section containing options related to the Clone Detector app appears in the menu.

The Model Transformer app has been removed from Simulink context menu. For more information about the new context menu, see New Simulink context menus prioritize frequently used functionality.

This image shows the appearance of the context menu in R2025b and in R2026a.
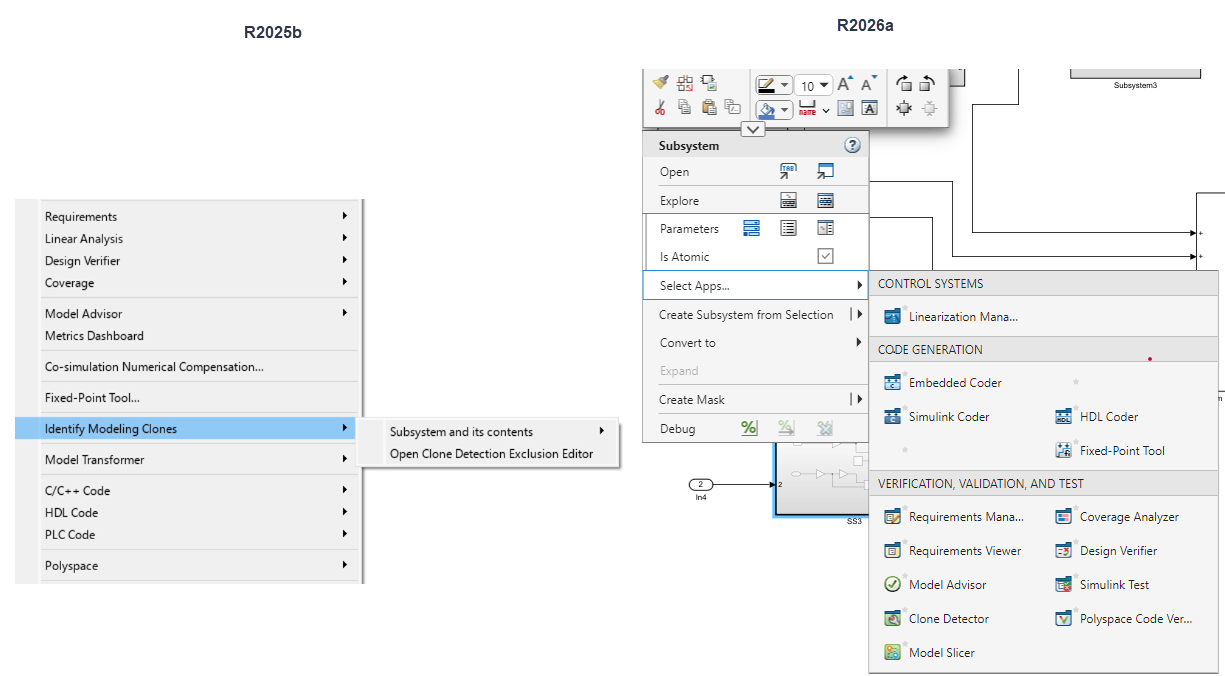
Context menus in R2025b and in R2026a.

Starting in R2026a, these Clone Detector app options are available in Simulink context menu:

  • To exclude a subsystem from clone detection analysis, select Exclude subsystem from clone detection button .

  • To open Clone Detection Exclusion Editor, select Exclusion editor button .

Access model version and analysis information from Model Advisor results

Starting in R2026a, you can access the version and analysis information of your model from Model Advisor results.

Use the VersionInfo property of the ModelAdvisor.SystemResult object to get the Simulink version, MATLAB version, and model version in use.

Use the AnalysisInfo property of the ModelAdvisor.SystemResult object to get the configuration settings, justifications, exclusions, options, and analysis duration. For more information, refer to ModelAdvisor.SystemResult.

Retrieve check results by execution status

Starting in R2026a, you can filter and obtain multiple check results based on the check IDs and check execution status. For more information, refer to getCheckResults.

Result object for added exclusions

Starting in R2026a, the Advisor.addExclusion function returns an object that provides information about the added exclusions.

ModelAdvisor.run configuration priority update

Starting in R2026a, when you use ModelAdvisor.run, the function selects the configuration file according to the following precedence:

  1. If you specify the configuration file using the Configuration name-value argument.

    results = ModelAdvisor.run(system,'Configuration',configFile);

  2. If you do not specify the Configuration name-value argument, the configuration file that you attach to the model using the Model Advisor configuration file (Simulink) parameter is used.

  3. If no configuration file is attached to the models, the session default configuration is used.

For more information, see ModelAdvisor.run.

Early detection checks

In R2026a, there are three new checks to help you detect issues early in the model development process before simulation or deployment. These three new checks support edit-time checking and are in the new Early Detection folder in the Model Advisor. For more information, see Model Advisor Checks for Early Detection.

Early Detection Check

Check ID
Check for Algebraic loops in modelsmathworks.earlydetection.algebraicLoop
Check for reference model configuration parameter mismatchmathworks.earlydetection.ModelRefModelConfigMismatch
Check usage of For and While Iterator subsystemsmathworks.earlydetection.IteratorSubsystem

MISRA C:2023 compliance in High-Integrity System Modeling

The high-integrity system modeling guidelines and their associated checks, compliant with MISRA C:2012, are also compliant with MISRA C:2023. Starting with R2026a, the Model Advisor will include folders and checks exclusively referencing MISRA C:2023, which also maintain compliance with MISRA C:2012.

Updated High-Integrity Systems Modeling checks

Starting in R2026a, these checks support new functionalities:

Model Advisor CheckCheck IDNew Functionality
Check relational comparisons on floating-point signalsmathworks.hism.hisl_0016New modeling conditions for floating-point comparisons in generated code.
Check usage of Relational Operator blocksmathworks.hism.hisl_0017Supports edit-time checking to identify violations of only block outputs.
Check usage of Logical Operator blocksmathworks.hism.hisl_0018Supports edit-time checking to identify violations of only block outputs.
Check for root Output ports with missing range definitionsmathworks.hism.hisl_0075Supports edit-time checking.
Check model object namesmathworks.hism.hisl_0032New input parameter Ignore default block names allows to exclude default block names from checking.

Updated MAB and JMAAB Modeling checks

Starting in R2026a, these checks support new functionalities:

Model Advisor CheckCheck IDNew or Modified Functionality
Check model font settingsmathworks.jmaab.db_0043Supports Stateflow atomic box and graphical function inspection targets.
Check output data type of operation blocksmathworks.jmaab.jc_0651New input parameter Excluded block type list to add or delete block types and/or mask types to exclude from the check.
Check Output data type of operation blocksmathworks.jmaab_v6.jc_0651New input parameter Excluded block type list to add or delete block types and/or mask types to exclude from the check.
Check if tunable block parameters are defined as named constantsmathworks.jmaab.jc_0645New input parameter Allowed calibration values to specify which numeric values are permitted for calibration variables in your model.

  CI/CD Automation for Simulink Check (August 2026)

With the support package, you can now:

  • Control which pipeline runs to download cached artifacts from by using the new DownloadFromSuccessfulRunsOnly property in the pipeline generator options object. By default, the pipeline downloads cached artifacts from only the last successful run. Set this property to false to download cached artifacts from the last completed run, regardless of status. For more information, see Integrate Process into CI and the pipeline generator options object for your CI platform.

  • Run tests in parallel by using the new UseParallel property of the padv.builtin.task.RunTestsPerModel task.

  • View coverage by using the new coverage report properties of the padv.builtin.task.RunTestsPerModel task.

  • Run Model Advisor in parallel mode by using the ParallelMode and NumWorkers properties of the padv.builtin.task.RunModelStandards.

 Compatibility Considerations

  • Update padv.builtin.task.GenerateSDDReport task inputs to use only "sl_model_file" and "sl_harness_file" artifact types. The task no longer supports "sl_library_file" or "zc_file" artifact types.

  • Replace padv.Preferences with padv.ProjectSettings or padv.UserSettings to programmatically control settings for incremental builds, build system logging, and other behaviors. The padv.Preferences class is removed.

    Update your code to replace instances of padv.Preferences with either padv.UserSettings.get() or padv.ProjectSettings.get(), depending on which property you need to access.

    padv.Preferences PropertyUpdate
    DetectDuplicateOutputs Replace instances of padv.Preferences with padv.UserSettings.get().
    GarbageCollectTaskOutputs
    ShowDetailedErrorMessages
    TrackProcessModel
    FilteredDigitalThreadMessages Replace instances of padv.Preferences with padv.ProjectSettings.get().
    IncrementalBuild
    EnableModelCaching
    MaxNumModelsInCache
    MaxNumTestResultsInCache
    SuppressOutputWhenInteractive

    For example:

    FunctionalityUse This Instead
    % changing run-time setting
    p = padv.Preferences;
    p.DetectDuplicateOutputs = false;
    % changing run-time setting
    pu = padv.UserSettings.get();
    pu.DetectDuplicateOutputs = false;
    % changing project setting
    p = padv.Preferences;
    p.IncrementalBuild = false;
    % changing project setting
    ps = padv.ProjectSettings.get();
    ps.IncrementalBuild = false;

    For more information, see Specify Settings for Process Advisor and Build System.

 Functionality being removed or changed

generateReport function requires Dashboard argument

Errors

Starting in R2026a, when you generate a report for a metric engine object, you must specify the Dashboard argument of the generateReport function. In prior releases, the generateReport function generates a model testing report by default.

To generate a model testing report, you must update your code:

generateReport(metric_engine,Dashboard="ModelUnitTesting")

Model Testing Dashboards reflect new untested test result outcome

The Model Testing Dashboards have been updated to use the new untested result outcome from Simulink Test. For more information, see New untested result outcome (Simulink Test).

In releases prior to R2026a, the Model Testing Dashboards use:

  • Inconclusive for tests that ran but are missing pass/fail criteria

  • Untested for tests that did not run

Starting in R2026a, the Model Testing Dashboards now use:

  • Untested for tests that ran but did not perform verification

  • Not Run for tests that have not run

Additionally, the metrics related to the Inconclusive widget have been removed and replaced. Update your code to use the replacement metrics instead.

Previous Metric IDUse This InsteadMore Information
TestCaseVerificationStatus

slcomp.mt.TestStatus

Model Test Status
TestCaseVerificationStatusDistributionslcomp.mt.TestStatusDistributionModel Test Status Distribution

Update logic in your code that uses the results from these metrics.

Before R2026a, the metric results return numeric test verification statuses:

  • 0 — The test is missing pass/fail criteria.

  • 1 — The test has pass/fail criteria.

  • 2 — The test was not run.

Now, the metric results return descriptive character arrays:

  • 'Failed' — The test ran and returned a fail result.

  • 'Passed' — The test ran and returned a pass result.

  • 'Disabled' — The test is intentionally excluded from execution and will not run.

  • 'Not run' — The test has not run.

  • 'Untested' — The test ran, but no verification was performed. This occurs if no verify statements or other criteria were specified, or if the criteria were specified but not executed.

View test case meta information using a single metric

Warns

Starting in R2026a, you can use a single metric ID to collect meta information for test cases, including the test case type and associated test tags. The previous metrics have been replaced by a new metric, slcomp.TestCaseInfo.

When you collect this metric, the Value property returns a structure with two fields:

  • Type — The type of test, returned as either 'Simulation', 'Baseline', or 'Equivalence'.

  • Tags — An array of unique tags associated with the test case.

Update your code to use the metric ID slcomp.TestCaseInfo and the Type and Tags fields.

Previous Metric IDUse This InsteadMore Information
TestCaseType

slcomp.TestCaseInfo

Test Case Info

TestCaseTag

Enhanced descriptions in metric result values

Starting in R2026a, certain metrics return descriptive labels instead of numeric values.

In previous releases, metrics such as slcomp.mt.TestStatus return a numeric value such as 0, 1, 2, or 3 that represents the status of a test.

Now, when you execute the metric, the Value property in the metric results returns a structure with a Status field that describes the test status. For example:

result = getMetrics(metric_engine,"slcomp.mt.TestStatus");
result.Value
ans = 

  struct with fields:

    Status: 'Failed'
The exact descriptions vary depending on the metric.

The descriptions come directly from the metric results and are not translated in the dashboard UI. See the documentation for localized descriptions.

The metrics in the following table have been removed and replaced. Update your code to use the replacement metrics instead. For the replacement metrics, the Value property of the metric result returns a structure that includes both a Count field and a Status field, instead of a single numeric value.

Previous Metric IDUse This InsteadMore Information
RequirementWithTestCaseTestCasesPerRequirementTests Per Requirement
TestCaseWithRequirementRequirementsPerTestCaseRequirements per Test Case

For the following metrics, the Value property of the metric result now returns a structure that includes descriptive information instead of numeric values. Update code that relies on the Value property.

For the following metrics, the BinEdges field in the Value property of the metric result now uses a cell array of descriptive information instead of numeric vectors. Update code that relies on the BinEdges field.

Change in metric IDs for Halstead complexity metrics

Starting in R2026a, the metric IDs for the Halstead complexity metrics have changed.

Previous Metric IDUse This Instead
sldesignlayer.SimulinkHalsteadComplexity slcomp.SimulinkHalsteadComplexity
sfdesignlayer.StateflowHalsteadComplexity slcomp.StateflowHalsteadComplexity
mldesignlayer.MATLABHalsteadComplexity slcomp.MATLABHalsteadComplexity

To automatically get the metrics IDs that the Model Maintainability Dashboard uses, use the getAvailableMetricIds function:

maintainabilityMetrics = getAvailableMetricIds(metric_engine,...
App="DashboardApp",Dashboard="ModelMaintainability")

Unused project model testing metrics will be removed

Still runs

Starting in R2026a, the Project Model Testing dashboard no longer uses or displays these metrics:

  • project.mt.ComponentTestStatusDistribution

  • project.mt.ComponentTests

  • project.mt.Tests

  • project.mt.ComponentCoverageBreakdownAverage

  • project.mt.ComponentTestWithRequirementAverage

  • project.mt.ComponentRequirementWithTestAverage

  • project.mt.ComponentRequirements

  • project.mt.Requirements

These metric IDs will be removed in a future release. Since these metrics are no longer available from the API, the getAvailableMetricIds function now returns an empty string array when you specify the dashboardIdentifier as "ProjectModelTesting". To collect project metrics programmatically, you can use the new executeDashboardMetrics function.

To view project metric results, use the widgets in the Project Model Testing dashboard as shown in Summarize Status of Testing for Project. For the model testing metrics, you can continue to access metrics programmatically using the metric.Engine APIs.

Dashboard option to hide requirements metrics has been removed

Starting in R2026a, the Hide requirements metrics option has been removed from the dashboard project. In previous releases, if you do not perform requirements-based testing and want to hide non-compliant requirement metrics, you can hide the Test Analysis section of the Model Testing Dashboard by selecting Hide requirements metrics.

Now, you can hide the compliance overlays for requirements metrics by selecting No Threshold or Testing without Requirements in the threshold settings in the top-left corner of the dashboard.
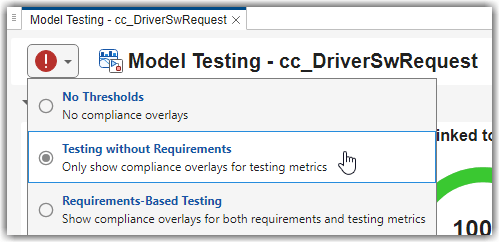
Threshold settings for Model Testing Dashboard

Metrics Dashboard app has been removed from Simulink context menu

Starting in R2026a, the Metrics Dashboard app is no longer on the Simulink context menu. For more information, see New Simulink context menus prioritize frequently used functionality.

ModelAdvisor.ListViewParameter class has been removed

Starting in R2026a, the ModelAdvisor.ListViewParameter class and its properties have been removed from Model Advisor.

ErrorSeverity method has been removed

Starting in R2026a, the ErrorSeverity method of the ModelAdvisor.Check class has been removed from Model Advisor. To specify the error severity for a check, use Check results when issues are flagged in the Model Advisor Configuration Editor.

setListViewParameter and getListViewParameter functions for have been removed

Starting in R2026a, the setListViewParameter and getListViewParameter object functions for Simulink.ModelAdvisor have been removed from Model Advisor.

Advisor.Application class will be removed

Still runs

The Advisor.Application class and its APIs will be removed in a future release. Use ModelAdvisor.run instead. This change streamlines and modernizes the workflow for running Model Advisor checks.

Detail style checks not to use setCheckErrorSeverity and setCheckResultStatus functions

Starting in R2026a, while implementing the detail style checks, avoid using these functions:

  • setCheckErrorSeverity (Simulink), which sets the severity level to error, which may be too stringent for style-related issues.

  • setCheckResultStatus (Simulink), which sets the status of a check result, which may not be necessary for style-related issues.

Model Advisor Highlighting dialog box removed

Starting in R2026a, when you open the Model Metrics Dashboard on any model and run All Metrics, clicking a bar for Model Advisor Check Issues and then selecting a component hyperlink in the table now opens the Model Advisor. The Model Advisor Highlighting dialog box no longer appears in this workflow.

Creating exclusions not supported for failed checks

Starting in R2026a, creating Model Advisor exclusions for failed checks in the Model Advisor is not supported. For more information, see Exclude Blocks from Model Advisor Check Analysis.

IsInformer and IsViolation properties have been removed

Starting in R2026a, the IsInformer and IsViolation properties of the ModelAdvisor.ResultDetail class have been removed. Specify the severity of Model Advisor check results by using the ViolationType property instead. For more information, see ModelAdvisor.ResultDetail.

ParallelMode renamed to UseParallel in ModelAdvisor.run

Starting in R2026a, the ParallelMode input argument of the ModelAdvisor.run function is renamed to UseParallel. While ParallelMode is still supported for backward compatibility, it is recommended to use UseParallel. For more information, see ModelAdvisor.run.

addModelAdvisorProcessFcn function will be removed

Warns

The addModelAdvisorProcessFcn function is not recommended for use since R2017b. Starting in R2026a, addModelAdvisorProcessFcn is not supported.

R2025b

Bug Fixes

Quality and stability improvements

R2025b delivers quality and stability improvements, building on the new features introduced in R2025a.

R2025a

New Features, Bug Fixes, Compatibility Considerations

 View a summary of model testing metrics in the Project Model Testing dashboard

In R2025a, you can assess the status and quality of the models in your project by using the Project Model Testing dashboard. The dashboard summarizes the model testing, coverage, and requirements traceability across the units in your project.

For more information, see Summarize Status of Model Testing for Project and Project Model Testing Metrics.
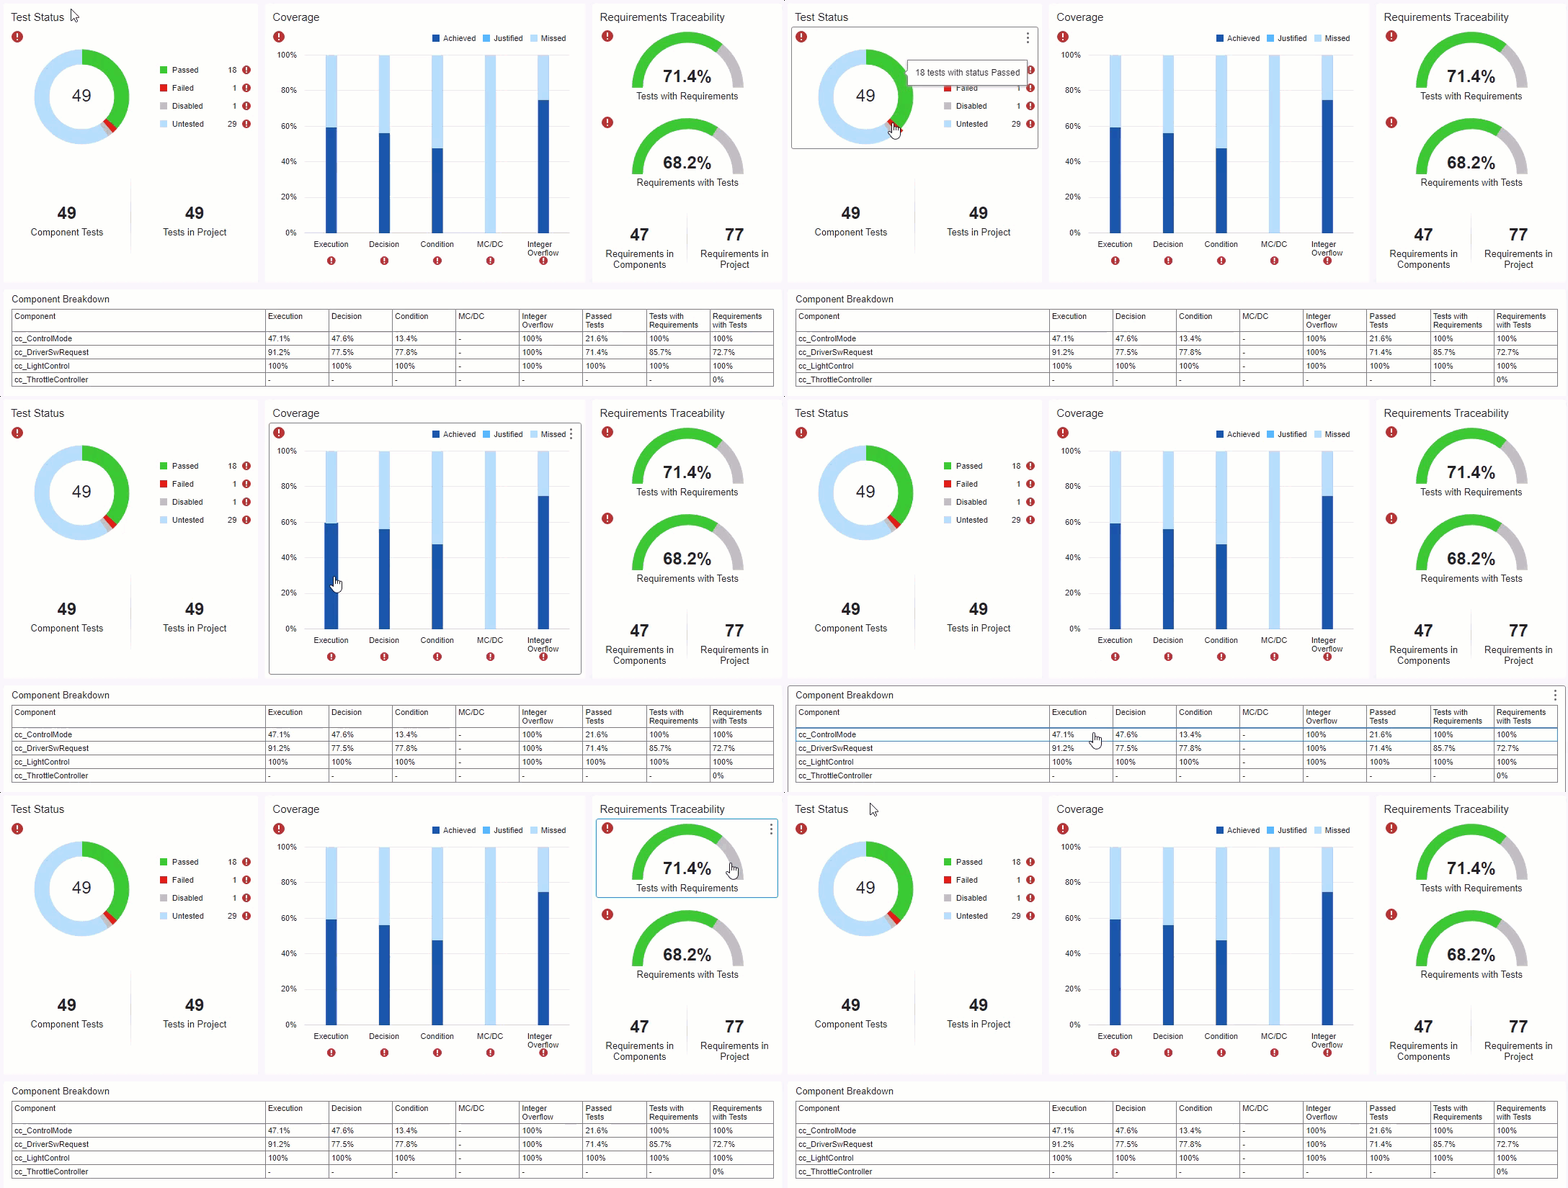
Project Model Testing dashboard with sections for Test Status, Coverage, Requirements Traceability, and Component Breakdown

 High-Integrity System Modeling Guidelines for AUTOSAR and MISRA C:2012 Coding Standards Compliance

Starting in R2025a, the high-integrity system modeling guidelines provide compliance with select aspects of AUTOSAR modeling and MISRA C™:2012 coding standards.

To access the high-integrity checks supported by AUTOSAR, in the Model Advisor, in the Check Selector pane, open the folder By Task > Modeling Standards for AUTOSAR > High-Integrity Systems. For more information, see Model Advisor Checks for AUTOSAR Modeling.

To access the high-integrity checks supported by MISRA C:2012 coding standards, in the Model Advisor, in the Check Selector pane, open the folder By Task > Modeling Standards for MISRA C:2012 > High-Integrity Systems. For more information, see Model Advisor Checks for MISRA C:2012 Coding Standards.

Load, unload, and justify multiple violations

Starting in R2025a, you can use Model Advisor to justify multiple violations. The Model Advisor report includes the justification file name for better traceability. If your model contains preloaded justifications, you can unload them, thereby removing the applied justifications and resetting the model. For more information, see Address Model Check Results.

Programmatically update input parameters in Model Advisor configuration

Starting in R2025a, you can programmatically update and retrieve input parameters in the Model Advisor configuration by using the Model Advisor Configuration API. To modify or get the value of an input parameter in an existing configuration, create an Advisor.Config object and load the configuration JSON file as the active configuration by using the loadConfig function. For more information, see Customize Model Advisor Configuration Programmatically.

This table lists the functions in the Model Advisor Configuration API:

APIPurpose
getInputParameters

Return input parameters for specified check

setInputParameters

Update specified input parameter for specified check

getInputParameterByName

Return value of specified input parameter for specified check

setInputParameterByName

Update value of specified input parameter for specified check

Timeout Policy for Custom Edit-Time Checks

Starting in R2025a, when a registered custom check exceeds the 500 milliseconds limit, a timeout banner appears on the Simulink canvas. For more information, see Define Edit-Time Checks to Comply with Conditions That You Specify with the Model Advisor.

Consistent behavior of checks with variants

Starting in R2025a, the behavior of checks with variants is consistent. Noncompile checks analyze all variant choices, while compile checks analyze active variants only. This update supports High-Integrity, MAB, and JMAAB checks.

 Updated JMAAB checks

Starting in R2025a, these JMAAB checks are modified.

 Updated High-Integrity Systems Modeling checks

Starting in R2025a, these checks support edit-time checking and bus element ports:

Traceability and navigation enhancements for dashboard trace views

In R2025a, you can use the Traceability tab in the Dashboard window to manage artifact traceability for your project and to open new trace views for your project. The new trace view toolbar allows you to search for specific artifacts and navigate large projects with complex hierarchies by using the Cluster layout. You can view the direct traceability connections for specific artifacts in the new Artifact Neighbors panel. For more information, see Explore Traceability Information Using Trace Views.

Additionally, the digital thread can now analyze:

  • Code Analyzer configuration files

  • Requirement justifications

  • System Composer allocation sets

  • System Composer profile XML files

For more information on how the digital thread traces relationships between artifacts, see Monitor Artifact Traceability and Detect Outdated Results with Digital Thread.
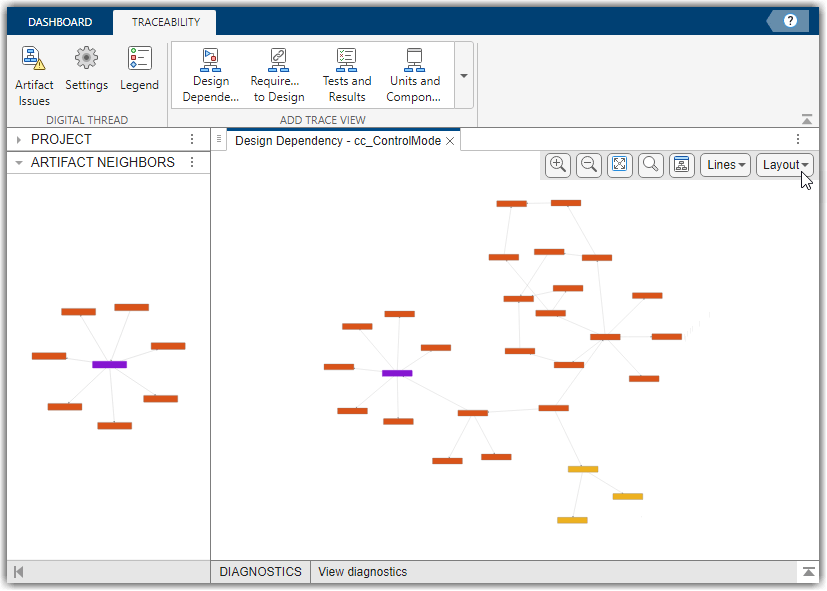
Design dependency trace view for an example model showing the new trace view toolbar, cluster layout, and direct artifact neighbors

Collect model maintainability metrics for Stateflow objects that use C as the action language

The Stateflow decision count metric, slcomp.StateflowDecisions, now counts code decisions from Stateflow objects that use C as the action language. Previously, the metric only counted code decisions for Stateflow objects that used MATLAB as the action language.

The Stateflow decision count metric contributes to these metrics:

MetricMetric ID
Stateflow Decision Countslcomp.StateflowDecisions
Stateflow Decision Distributionslcomp.StateflowDecisionsDistribution
Stateflow Design Cyclomatic Complexityslcomp.SFCyclomaticComplexity
Overall Design Cyclomatic Complexityslcomp.OverallCyclomaticComplexity

Additionally, the Stateflow decision count metric now counts graphical decisions from the number of transitions with conditions or non-empty triggers. Previously, the metric only counted the graphical decisions from the number of transitions with conditions.

For more information, see Stateflow Decision Count.

View diagnostic errors and warnings from metric collection in metric.Result objects

When you use metric.Engine to collect metric results, you can view the diagnostic errors and warnings that occur during metric collection by using the new Diagnostics property in the metric.Result object. For example, you can collect metric results by using the metric engine and then use the diagnostics in the metric results to check for errors or warnings.

metric_engine = metric.Engine();
execute(metric_engine,"slcomp.ComponentInterfaceSignals");
results = getMetrics(metric_engine,"slcomp.ComponentInterfaceSignals");
results.Diagnostics
ans = 

  struct with fields:

      Severity: "WARNING"
    Identifier: 'dashboard:maintainability:InheritDataType'
       Message: 'Metric 'slcomp.ComponentInterfaceSignals' was unable to statically resolve the data type for port 'cc_ControlMode/driver_request' of 'cc_ControlMode'. Make sure to specify valid data types other than 'Inherit: auto' for root outports and inports.'

Previously, these diagnostics were only visible in the Diagnostics panel in the dashboard. If there was an error during metric collection, the metric engine did not return a metric.Result object.

For more information, see metric.Result.

Identify tests that do not count as component tests in the Model Testing Dashboard

Starting in R2025a, you can identify tests that do not count as component tests, such as tests on libraries, subsystem references, and virtual subsystems, by using the new Independent widget in the Model Testing Dashboard. Previously, the dashboard only showed these types of tests under the Others folder in the Artifacts panel.

Independent tests can execute independently of the component and can behave differently depending on the conditions specified in the test harness. Therefore, these tests do not definitively indicate the quality of component testing and do not contribute to the other metric results in the Model Testing Dashboard. You can view the component tests and independent tests by using the new Component and Independent widgets in the Test Breakdown section of the Model Testing Dashboard. For more information, see Component Tests and Independent Tests.

Additionally, you can also programmatically identify the functional requirements implemented in the component. For more information, see Component Requirements.
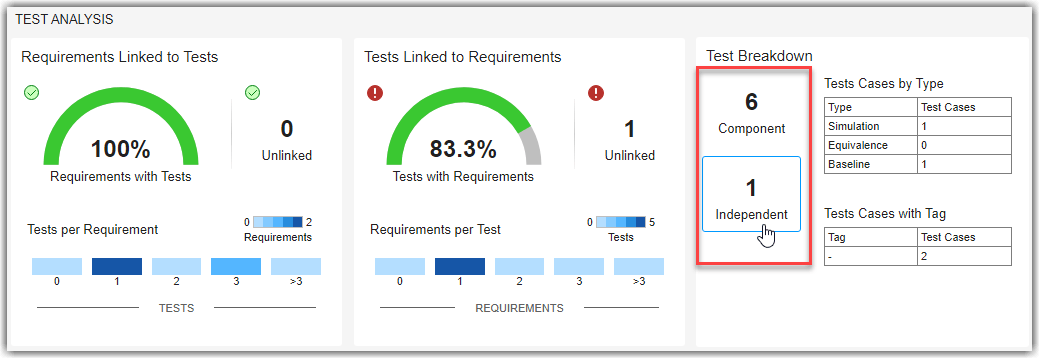
Model Testing Dashboard showing widgets for Component and Independent tests

Analyze dependencies by using Model Slicer during simulation of models

Starting in R2025a, you can open Model Slicer while a model is paused during simulation. This enables you to:

  • Highlight dependencies of ports, signals, and blocks at each time step.

  • View signal values using port value labels.

To launch Model Slicer during simulation, in the Apps, in the Model Verification, Validation, and Test section, click Model Slicer. For more information, see Using Model Slicer During Simulation.

Programmatically exclude components from clone detection analysis

Starting in R2025a, you can programmatically exclude components, such as subsystems or referenced models, from clone detection analysis in a Simulink model by using these functions:

FunctionPurpose
Simulink.CloneDetection.addExclusionsExclude component from clone detection
Simulink.CloneDetection.getExclusionsGet list of components excluded from clone detection
Simulink.CloneDetection.deleteExclusionsRemove component from clone detection exclusion list

For more information, see Exclude Components from Clone Detection.

Use filenames up to 150 characters long

Before R2025a, the maximum length of MATLAB identifiers, including names of variables, functions, Simulink models, libraries, and many other entities, was limited to 63 characters. Due to this limitation, scenarios such as providing input library names for clone detection or saving backup models after model refactoring were also restricted to 63 characters.

Starting in R2025a, the maximum identifier length limit for filenames, including Simulink model names and library names, is extended to 150 characters. The filenames of backup models and the temporary files that are generated from model refactoring can also be up to 150 characters in length.

 CI/CD Automation for Simulink Check (October 2025): Pipeline Generator Version 2 Enhancements

With the support package, you can now:

  • Use pipeline generator version 2 with R2025a.

  • Generate enhanced pipelines for Azure® DevOps and GitLab®. For more information, see:

  • Specify a container image for all downstream jobs by using the RunnerType and ImageTag properties.

    options = padv.pipeline.GitHubOptions(GeneratorVersion=2);
    options.RunnerType = "container";
    options.ImageTag = "mycompany/docker-pipeline-runner:latest";

  • Store artifacts in:

    • Amazon S3™:

      options = padv.pipeline.GitHubOptions(GeneratorVersion=2);
      options.ArtifactServiceMode = "s3";
      options.S3AwsAccessKeyID = "AKIAIOSFODNN7EXAMPLE";
      options.S3BucketName = "my-artifacts-bucket";

    • Azure Blob Storage:

      options = padv.pipeline.GitHubOptions(GeneratorVersion=2);
      options.ArtifactServiceMode = "azure_blob";
      options.AzContainerName = "mycontainer";

  • Support projects in subfolders of the repository root by specifying the RelativeProjectPath property.

    options = padv.pipeline.GitHubOptions(GeneratorVersion=2);
    options.RelativeProjectPath = "src/myproject";

 Compatibility Considerations

If you are using pipeline generator version 2 for GitHub or Jenkins®, the setup and requirements have changed, and the previous setup is no longer supported. Review the new example and update the setup and code for your CI platform:

Previously, you provided configuration details using repository or environment variables. Now, you must specify these details as properties of your pipeline generation options object. For migration information, see:

CI/CD Automation for Simulink Check (October 2025): OpenTelemetry Integration

With the support package, you can now gather detailed timing and execution data when you run your process by enabling integration with OpenTelemetry™. You can enable OpenTelemetry by using either the EnableOpenTelemetry argument of the runprocess function or the EnableOpenTelemetry property of your pipeline generator options object. See Integrate Process into CI.

For more information, see Collect Detailed Execution Data with OpenTelemetry Integration.

CI/CD Automation for Simulink Check (October 2025): Index Models and Find Subsystems

With the support package, you can now index Simulink models in a searchable database using the new built-in task padv.builtin.task.IndexModels. You can then search, filter, and browse your models using the Model Finder user interface.

Additionally, you can now find subsystems in models with the new built-in query padv.builtin.query.FindSubsystemsForModel. You can get the block paths for subsystem and block diagram artifacts by using the new utility function padv.util.getSubsystemPath.

CI/CD Automation for Simulink Check (October 2025): Create Custom Tokens

With the support package, you can now create custom tokens for dynamic filenames and paths. Previously, only built-in tokens such as $TIMESTAMP$ and $ITERATIONARTIFACT$ were supported. For more information, see addToken and resolvePath.

CI/CD Automation for Simulink Check (October 2025): Requirement Link File Handling

With the support package, you can now include requirement link files as dependent artifacts by using the new property IncludeRequirementLinkFiles for the built-in query padv.builtin.query.GetDependentArtifacts. Built-in tasks that report on requirement links now automatically include requirement link files as dependencies.

CI/CD Automation for Simulink Check (October 2025): Example of Custom Query for Multiple Labels

You can now view and run an example custom query that finds project artifacts matching multiple label criteria. The example custom query file, CustomFindArtifactsMultipleLabels.m, is in the examples folder in your support package installation location.

To open an example live script that can run the query in MATLAB, enter:

examplesFolder = fullfile(matlabshared.supportpkg.getSupportPackageRoot,"samples","templates","examples");
exampleFile = "exQuery_MultipleLabels.mlx";
open(fullfile(examplesFolder,exampleFile));

CI/CD Automation for Simulink Check (October 2025): Support for Subsystem References, Library Files, and System Composer Models

With the support package, you can now merge test results for subsystem reference files and library files by using the built-in task padv.builtin.task.MergeTestResults. You can also search for these and other artifact types by specifying the ArtifactType argument for the built-in queries FindModels, FindModelsWithLabel, FindModelsWithTestCases, and FindTestCasesForModel.

Additionally, starting in R2024b, you can find top model System Composer models with the built-in query padv.builtin.query.FindTopModels.

 CI/CD Automation for Simulink Check (October 2025): UpdateThisModelReferenceTarget property will be removed from GenerateCode Task

The UpdateThisModelReferenceTarget property of built-in task padv.builtin.task.GenerateCode will be removed in a future release. The default value is now "" (unset).

CI/CD Automation for Simulink Check (November 2025): Specify Custom Filename and Location for Model Advisor Justifications File

With the support package, you can now customize how the built-in query padv.builtin.query.FindMAJustificationFileForModel finds Model Advisor justifications files by using the following new properties:

  • JustificationFilename property — Specify a custom filename pattern for the justifications file.

  • UseModelFolder property — Search for the justifications file in the same folder as the model file.

 CI/CD Automation for Simulink Check (January 2026)

In the support package:

 Compatibility Considerations

For OpenTelemetry integrations, the built-in task padv.builtin.CollectMetrics now reports only one example metric instead of multiple metrics. Previously, the task attempted to publish several metrics, which was not portable across MATLAB releases. Now, the CollectMetrics task reports only the overall block count (slcomp.OverallBlocks) for a Simulink model. To instrument additional metrics, use the implementation for the slcomp.OverallBlocks metric inside the CollectMetrics class as a reference.

CI/CD Automation for Simulink Check (February 2026)

In the support package:

  • For Jenkins pipeline generator version 2, the template file, Jenkinsfile_pipeline_gen, now uses the Git™ submodule checkout behavior that you define in the SCM section of the Jenkins Pipeline configuration page. For more information, see Pipeline generator version 2 template file uses Git submodule checkout behavior from Jenkins SCM configuration.

    To access the updated Jenkinsfile_pipeline_gen template file in MATLAB, enter:

    copyfile(fullfile(matlabshared.supportpkg.getSupportPackageRoot, ...
    "toolbox/padv/samples/jenkinsV2/auto_gen/Jenkinsfile_pipeline_gen"));

  • For GitLab pipeline generator version 2, if you are using the CheckoutSubmodules property, make sure to also update the .gitlab-ci.yml file to specify your GIT_SUBMODULE_STRATEGY there also. The template .gitlab-ci.yml now includes a commented out line for specifying this information as part of the top-level pipeline definition:

      # GIT_SUBMODULE_STRATEGY: recursive

  • For GitLab pipeline generator version 2, you can now control the name of the upstream job that the pipeline generator fetches artifacts from. By default, the upstream job is named "SimulinkPipelineGeneration", but you can now use the new UpstreamJobName property in padv.pipeline.GitLabOptions to specify a different name for that upstream job.

    op.UpstreamJobName = "PipelineGeneration";

  • The "ci-addons.Dockerfile" file is now available from the "samples" folder of the support package. This sample Dockerfile allows you to extend a Docker® image with additional CI tools for pipeline generation. For more information, see Build and Use Docker Image to Run Processes.

    In MATLAB, you can copy the sample Dockerfile, ci-addons.Dockerfile, by entering:

    copyfile(fullfile(matlabshared.supportpkg.getSupportPackageRoot, ...
    "toolbox/padv/samples/ci-addons.Dockerfile"));

  • For pipeline generator version 2, the template files have been updated to use OS-agnostic copy commands when copying the generated pipeline file.

 Functionality being removed or changed

Stateflow decision count metric returns CodeDecisions instead of MATLABCodeDecisions

Previously, the Stateflow decision count metric, slcomp.StateflowDecisions, contained a field for MATLABCodeDecisions. Because the Stateflow decision count metric now counts decisions in charts that use C as the action language, the metric contains a field named CodeDecisions. If you programmatically collect metric results and use the field MATLABCodeDecisions, you must update your code to use the field CodeDecisions.

FunctionalityUse This Instead
metric_engine = metric.Engine;
execute(metric_engine,"slcomp.StateflowDecisions");
results = getMetrics(metric_engine,"slcomp.StateflowDecisions");
value = results.Value;
value.MATLABCodeDecisions
metric_engine = metric.Engine;
execute(metric_engine,"slcomp.StateflowDecisions");
results = getMetrics(metric_engine,"slcomp.StateflowDecisions");
value = results.Value;
value.CodeDecisions

Check hisl_0008: "Check usage of For Iterator blocks" no longer supports control display of input and output ports

Behavior change

Starting in R2025a, Model Advisor check Check usage of For Iterator blocks (mathworks.hism.hisl_0008) no longer checks the following control display configuration parameters:

  • Set Next i (iteration variable) externally

  • Show iteration variable

Note that the configuration parameters are no longer supported by the check because modeling conditions C and D have been removed from the High-Integrity System Modeling guideline hisl_0008: Usage of For Iterator Blocks.

R2024b

New Features, Bug Fixes, Compatibility Considerations

 Programmatically customize Model Advisor configuration

Starting in R2024b, you can customize the Model Advisor configuration programmatically by using Model Advisor Configuration APIs. Using the APIs, you can:

  • Modify existing configurations.

  • Create new custom configurations.

  • Create a new configuration for a predefined set of checks.

The APIs provide you an easier and flexible way of customizing configurations by:

  • Adding, removing, and organizing built-in and defined custom checks in a hierarchy.

  • Specifying checks that you want to use for the Model Advisor analysis.

  • Disabling and enabling checks and folders.

You can save the organizational hierarchy in a JSON file and use it as the default Model Advisor configuration or associate it with a model. To create or modify a configuration, create an Advisor.Config object. By default, after creation, the object provides you access to a blank configuration that you can use to create a new custom configuration. If you intent to modify an existing configuration, load the configuration JSON file by using the loadConfig function as the active configuration. Use the Advisor.Config object functions to customize the active configuration. For more information, see Customize Model Advisor Configuration Programmatically.

 MAB v6.0 Support: New, updated, and removed guidelines and checks

Starting in R2024b, the Model Advisor supports version 6.0 of MathWorks® Advisory Board (MAB) modeling guidelines.

This table lists the newly introduced MAB v6.0 guidelines:

This table lists the updated MAB v6.0 guidelines:

MAB Modeling GuidelineDescription
ar_0002: Usable characters for folder namesCustom Parameter is added for all the sub IDs.
db_0032: Signal line connectionsSub IDs a1, a2, b, and c are removed and included in jc_0903: Prohibition of overlapping or crossing of blocks and signal lines. Sub IDs d and e are renamed as a and b respectively. New sub ID c is inherited from db_0141: Signal flow in Simulink models.
db_0097: Position of labels for signals and busesSub ID a is removed and included in jc_0903: Prohibition of overlapping or crossing of blocks and signal lines. Sub IDs b and c are renamed as a and b respectively.
db_0125: Stateflow local dataLocal data term in the sub ID d is replaced with Stateflow data.
db_0127: Limitation on MATLAB commands in Stateflow blocksSub IDs a1 and a2 are renamed as a and b respectively.
db_0129: Stateflow transition appearanceSub IDs a, b, and c are removed and included in jc_0904: Prohibition of overlap/intersection of states and transition lines. Sub IDs d and e are renamed as a and b respectively.
db_0141: Signal flow in Simulink modelsSub ID c is removed and included in db_0032: Signal line connections.
jc_0009: Signal name propagationNew sub ID c is added.
jc_0232: Usable characters for parameter namesSub IDs a, b, and c are removed. Sub IDs d, e, and f are renamed as a, b, and c respectively.
jc_0481: Use of hard equality comparisons for floating point numbers in StateflowNew operator <> is added.
jc_0627: Usage of Discrete-Time Integrator blocksSub ID b is removed and added as a supplementary of sub ID a.
jc_0630: Usage of Multiport Switch blocksSub ID b is included in the NA-MAAB recommendations. Input data types are added with examples for sub ID b.
jc_0644: Type settingExceptions are updated with new examples.
jc_0651: Implementing a type conversionDescription of sub ID a is updated with new examples.
jc_0741: Timing to update data used in state chart transition conditionsSub ID a is renamed as a1. Sub IDs a2 and b are newly added.
jc_0753: Condition actions and transition actions in StateflowSub IDs a1 and a2 are renamed as a and b respectively. Selection of sub IDs is provided in the Input Parameters section.
jc_0770: Position of transition labelSub ID a3 is newly added.
jm_0012: Usage restrictions of events and broadcasting eventsSub IDs a1, a2, and a3 are renamed as a, b1, and b2 respectively. Selection of sub IDs is provided in the Input Parameters section.
na_0011: Scope of Goto and From blocksSub IDs b and c are newly added.

This table lists the guideline that is removed from MAB v6.0:

Modeling GuidelineUse Instead
jc_0739: Describing text inside statesjc_0904: Prohibition of overlap/intersection of states and transition lines

 Updated JMAAB checks

Starting in R2024b, these existing JMAAB checks are modified to support edit-time checking:

Model Advisor CheckCheck ID
jc_0602: Consistency in model element namesmathworks.jmaab.jc_0602
jc_0642: Integer rounding mode settingmathworks.jmaab.jc_0642
jc_0061: Display of block namesmathworks.maab.jc_0061
jc_0645: Parameter definition for calibrationmathworks.jmaab.jc_0645
jc_0651: Implementing a type conversionmathworks.jmaab.jc_0651

Customize Model Advisor configuration tree using drag and drop

Starting in R2024b, using the Model Advisor Configuration Editor, you can customize the layout of the checks and folders of your Model Advisor configuration through drag and drop. You can now drag and drop:

  • Checks and folders from the library to your configuration tree to copy them in your configuration.

  • Checks and folders in your configuration tree to change their hierarchies or shift their positions.

For more information, see Use Model Advisor Configuration Editor to Customize Model Advisor.

Access specific Model Advisor check results using getCheckResults function

Starting in R2024b, you can access the result of a specific Model Advisor check by using the getCheckResults function for a ModelAdvisor.SystemResult object returned by getResults. Pass the Model Advisor check ID as the input whose result you want to access. The getCheckResults function returns the ModelAdvisor.CheckResult object of the check instance. Access the object properties to obtain the Model Advisor check result.

If you do not pass a check ID, the function returns a cell array of ModelAdvisor.CheckResult objects of all Model Advisor checks. For more information, see ModelAdvisor.SystemResult and ModelAdvisor.CheckResult.

Changes in Justification UI Elements

The Justification widget of Model Advisor check violations now includes these changes to its user-interface elements.

Previous UI ElementNew UI ElementDescription of Functionality
Add JustificationApplyNo change in functionality. Use this button to justify a model advisor check violation.
Edit icon.No change in functionality. Use the icon to edit the rationale for justification. After editing, click the icon to save your edits.
Delete icon.No change in functionality. Use the icon to delete a justification and set the justified violation back to the error or warning status.

For more information, see Justify Model Advisor Violations from Check Analysis.

Undo and redo changes during edit time for model refactoring checks

Starting in R2024b, you can revert or restore the changes you made during the edit time using the Identify clones from the linked library Model Advisor check.

You can revert or restore changes using the keyboard shortcuts. On a Windows® platform, the default keyboard shortcuts for undo and redo are Ctrl+Z and Ctrl+Y, respectively. The shortcuts are defined in your MATLAB preferences. For more information, see Customize Keyboard Shortcuts.

View external file dependencies for tests using a dashboard trace view

If your Simulink Test test files, test cases, and test iterations use external files as inputs, you can now view those external file dependencies by using the Tests and Results trace view in the Model Testing Dashboard or Model Design Dashboard. The Tests and Results trace view shows external files like coverage filters, baseline files, parameter override sets, and configuration setting overrides.

For information, see Explore Traceability Information Using Trace Views.
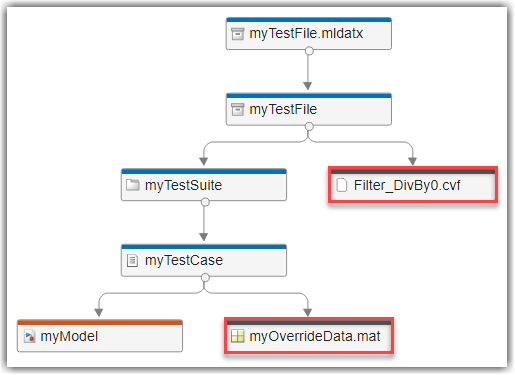
Tests and Results trace view showing relationship between test file and coverage filter file

View the units and components in your project using a dashboard trace view

In R2024b, you can view the units and components in your project by using the Units and Components trace view in the Model Testing Dashboard or Model Design Dashboard.

Previously, the Project panel in the Dashboard window listed the units in the project, organized by the components that referenced them. Now, the Project panel shows a flat list of the compatible artifacts for the current dashboard and the Units and Components trace view shows the relationship between the units and components in your project.

For more information, see Explore Traceability Information Using Trace Views.
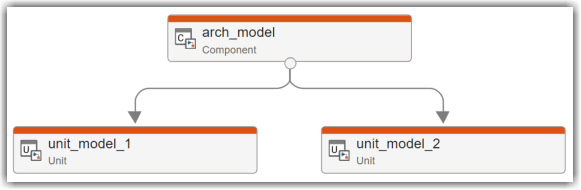
Trace view showing relationship between an architecture model component and unit models

Documentation for CI/CD Automation for Simulink Check support package available online from Simulink Check documentation

Starting in R2024b, the documentation for the CI/CD Automation for Simulink Check support package is included in the online documentation for Simulink Check and updates will be announced in the Simulink Check release notes.

The support package provides tools to help you integrate your model-based process into a continuous integration (CI) system, including the Process Advisor app, incremental build system, and pipeline generator. For information, see Continuous Integration.

CI/CD Automation for Simulink Check (September 2024 and October 2024)

With the support package, you can now:

To download and install the support package, see CI/CD Automation for Simulink Check. For more information, see Continuous Integration.

CI/CD Automation for Simulink Check (November 2024)

With the support package, you can now:

  • Generate requirements reports by using the new built-in task padv.builtin.task.GenerateRequirementsReport. Requirements reports can contain information like links to requirements, requirements change and revision information, and Implementation and Verification status summaries.

  • View traceability between your generated code and source models by generating code traceability reports with the new GenerateTraceReport and TraceReportName properties of the built-in task padv.builtin.task.GenerateCode.

  • Generate Jenkins pipelines that require fewer executors. Previously, the pipeline generator created Jenkins pipelines that required at least three executors. Now, the pipeline generator creates pipelines that only require one executor for serial pipelines or two executors for parallel pipelines. By default, the pipeline generator now uses the same executor for sequential stages in Jenkins. For more information, see Integrate Process into Jenkins and UseSameExecutorForSequentialStages.

Note that:

  • For padv.TaskResult objects, the ResultValues property will be removed in a future release. Use the Values property instead.

  • Previously, for Jenkins pipeline generation, you chose the agent by specifying the Jenkins options property AgentLabel. Since the new UseSameExecutorForSequentialStages property is true by default, the pipeline generator now ignores the AgentLabel property by default. You need to specify a top-level agent that can execute your pipeline in MATLAB, as shown in Integrate Process into Jenkins.

CI/CD Automation for Simulink Check (December 2024)

With the support package, you can now:

  • Create formal assessments to evaluate the compliance of task inputs and outputs against specific standards that you define in a padv.Assessment object. Starting in R2024a, when you point to the task status, the assessments show the specific objectives associated with the failures, warnings, and passing results that you see in the Details column. For more information, see Assess Quality of Task Results.
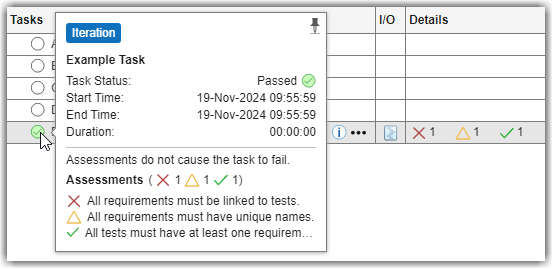
    Task status showing results from the individual task assessments. One assessment fails because not all requirements are linked to tests. One assessment has a warning because requirements must have unique names. One assessment passes because tests must have at least one requirement linked.

  • Add instructions to your tasks by specifying a Markdown file or binary file in the Instruction property. Starting in R2024a, when you click the task information icon , the rendered instruction text appears in Process Advisor.

  • Add custom tools to your tasks by using a padv.TaskTool object. Starting in R2024a, you can use those task tools to open custom App Designer or uifigure apps directly in Process Advisor or evaluate specific MATLAB commands.

  • Represent manual tasks that you perform outside the build system as a part of your process by using the TaskType name-value argument. For more information, see Create Custom Tasks.

  • Run your Process Advisor process as part of a MATLAB build by using the new task padv.buildtool.tasks.RunProcessTask in your build file.

  • Use the task property PredecessorTask to directly specify a predecessor task for the built-in tasks padv.builtin.task.AnalyzeModelCode, padv.builtin.task.MergeTestResults, and padv.builtin.task.RunCodeInspection. By default, these tasks expect outputs from upstream tasks with specific names. Previously, if you renamed an upstream task, you needed to reconfigure the input queries of these built-in tasks to find and get the outputs from your renamed task. Now, you can specify the PredecessorTask property instead.

  • Execute the built-in tasks padv.builtin.task.GenerateRequirementsReport, padv.builtin.task.GenerateSDDReport, and padv.builtin.task.GenerateSimulinkWebView in parallel. Previously, if you tried to run these tasks in parallel, these tasks generated an error due to the MATLAB Connector server running on non-default ports.

  • Enable or disable pipeline caching for a generated pipeline by using the EnablePipelineCaching property in the pipeline generator options for your CI platform.

Note that by default, the web views that you generate by using padv.builtin.task.GenerateSimulinkWebView no longer include the optional views for model requirements and coverage data. To include those views, specify the new task properties IncludeRequirements and IncludeCoverage as true.

To download and install the support package, see CI/CD Automation for Simulink Check. For more information, see Continuous Integration.

CI/CD Automation for Simulink Check (February 2025)

With the support package, you can now:

To download and install the support package, see CI/CD Automation for Simulink Check. For more information, see Continuous Integration.

 CI/CD Automation for Simulink Check (April 2025)

With the support package, you can now:

  • Generate enhanced pipelines and integrate with JFrog Artifactory by using pipeline generator version 2 for GitHub and Jenkins. Version 2 is recommended for enhanced file propagation and artifact management capabilities, but requires a different setup and workflow. For more information, see:

  • More easily edit user task states, programmatically set user task results with the padv.util.setUserTaskResult function, and directly run predecessors of user tasks. Additionally, user tasks now automatically disable the ability to mark the task complete if the predecessor tasks are not complete. See Create User Tasks.

  • View additional examples in the Process Advisor example project by selecting the new process Additional Examples in the process gallery. The Additional Examples process contains example tasks that use custom task apps created in App Designer. See Integrate Custom App into Process Advisor.

  • Limit query results to only artifacts added to the current open project by using the property InCurrentProject. This property is available for certain built-in queries like padv.builtin.query.FindArtifacts. The existing property InProject includes only artifacts that have been added to the current open project or referenced projects.

  • Open the Process Advisor app for a specific process or artifact by using the new processName and artifactName arguments of the processAdvisorWindow function.

  • Show project-level tasks in the model view of the Process Advisor app by using the ShowProjectLevelTasks property in padv.Process.

Additionally, the tasks in the Tasks column of Process Advisor are now collapsed by default. You can change this behavior in the Settings. See the Collapse tasks setting in Specify Settings for Process Advisor and Build System.

 Compatibility Considerations

If you have local copies of process models or built-in tasks that use the following internal functions, you need to update your code.

Previous FunctionalityUse This Instead
padv.internal.isMACA64padv.internal.util.isMACA64
padv.internal.warnWithoutBacktracepadv.internal.error.warnWithoutBacktrace
padv.internal.getModelNameFromAddresspadv.internal.util.getModelNameFromAddress
padv.internal.launchToolstripApppadv.internal.tools.launchToolstripApp
padv.internal.getArtifactNamepadv.internal.artifact.getName
padv.internal.validateSingleFileInputspadv.internal.validation.validateSingleFileInputs
padv.internal.getPadvRootDirpadv.internal.install.getPadvRootDir
padv.internal.is23bOrLaterpadv.internal.vercheck.is23bOrLater
padv.internal.OverrideConfigSetValuespadv.internal.tools.OverrideConfigSetValues
padv.internal.exportTraceReportpadv.internal.tools.exportTraceReport
padv.internal.hasGitpadv.internal.tools.hasGit
padv.internal.is24bOrLaterpadv.internal.vercheck.is24bOrLater
padv.internal.RMIConnectorOverridepadv.internal.tools.RMIConnectorOverride
padv.internal.loadLinkedArtifactspadv.internal.tools.loadLinkedArtifacts
padv.internal.isProductUsablepadv.internal.install.isProductUsable
padv.internal.getMergedCoveragepadv.internal.tools.getMergedCoverage
padv.internal.findProjectFilepadv.internal.util.prj.findProjectFile
padv.internal.mergeJUnitXMLFilespadv.internal.merge.junitXMLFiles
padv.internal.getCodeInspectionSummarypadv.internal.tools.getCodeInspectionSummary
padv.internal.is24aOrLaterpadv.internal.vercheck.is24aOrLater
padv.internal.ModelAdvisorUtils.canModelAdvisorUpdateCachepadv.internal.tools.ModelAdvisorUtils.canModelAdvisorUpdateCache
padv.internal.ModelAdvisorUtils.setCachePreferncepadv.internal.tools.ModelAdvisorUtils.setCachePrefernce
padv.internal.checkTestFileCallbackspadv.internal.tools.checkTestFileCallbacks
padv.internal.generateJunitReportpadv.internal.execution.utils.generateJunitReport

 Functionality being removed or changed

ModelAdvisor.SystemResult object returns number of checks with different statuses in a structure with multiple fields

Behavior change

Starting in R2024b, the ModelAdvisor.SystemResult object returns the numbers of checks with different statuses in the structure fields of the new Summary property. The structure contains these fields:

  • NotRun — Number of Model Advisor checks that do not run

  • Information — Number of Model Advisor checks with information

  • Passed — Number of Model Advisor checks that pass

  • Justified — Number of Model Advisor checks that are justified

  • Warning — Number of Model Advisor checks that warn

  • Failed — Number of Model Advisor checks that fail

  • Incomplete — Number of Model Advisor checks that ran incompletely

Previously, the object returned the numbers of checks that passed, failed, warned, and did not run in the numPass, numFail, numNotRun and numWarn properties, respectively. Access the Summary property of the ModelAdvisor.SystemResult object to get numbers of checks with different statuses.

This table shows an example of this change.

ExampleResult in R2024aResult Starting in R2024b

Open a model and create an Advisor.Application object.

openExample('sldemo_mdlref_basic');

app = Advisor.Manager.createApplication();

Run a Model Advisor analysis after specifying the root model for the analysis and get the analysis results as ModelAdvisor.SystemResult objects.

RootModel = 'sldemo_mdlref_basic';
setAnalysisRoot(app,'Root',RootModel);
run(app);
res= getResults(app)
res = 

  1×2 SystemResult array with properties:

    system
    Type
    numPass
    numFail
    numNotRun
    numWarn
    CheckResultObjs
res(1).numPass
ans =

     1
res = 

  1×2 SystemResult array with properties:

    System
    Type
    Summary
    CheckResults
res(1).Summary
ans = 

  struct with fields:

          NotRun: 2381
    Information: 0
         Passed: 1
      Justified: 0
        Warning: 0
         Failed: 0
     Incomplete: 0

For more information, see ModelAdvisor.SystemResult.

numPass, numFail, numNotRun, and numWarn properties will be removed

Still runs

The numPass, numFail, numNotRun, and numWarn properties of the ModelAdvisor.SystemResult object will be removed in a future release. To get the numbers of checks with different statuses, access the structure fields of the new Summary property. In addition, the object property CheckResultObjs has been renamed to CheckResults. The support for references to CheckResultObjs will be removed in a future release. For more information, see ModelAdvisor.SystemResult.

Removed Model Advisor checks

Starting in R2024b, hisf_0002: "Check Stateflow charts for ordering of states and transitions" (mathworks.hism.hisf_0002) has been removed because the configuration parameter User-specified state/transition execution order has also been removed. For more information, see Implicit state and transition ordering will be removed (Stateflow).

ModelAdvisor.Group and ModelAdvisor.FactoryGroup classes are not recommended

Still runs

ModelAdvisor.Group and ModelAdvisor.FactoryGroup classes are not recommended to create custom folders for custom checks. Instead, create a folder for custom checks in the By Product folder by using the publish method. Then, use the Model Advisor Configuration Editor or Advisor.Config API to customize the Model Advisor configuration.

R2024a

New Features, Bug Fixes, Compatibility Considerations

 View back-to-back testing metrics in the SIL and PIL Code Testing Dashboards

In R2024a, you can use the new back-to-back testing metrics in the SIL and PIL Code Testing dashboards to assess translation validation for your generated code. These metrics compare the normal mode and software-in-the-loop (SIL) or processor-in-the-loop (PIL) mode test runs, which test the equivalence between your model and generated code. The dashboards show the back-to-back test status and a breakdown of the statuses for each test in the software unit. For more information, see View Status of Code Testing Activities for Software Units in Project.

Alternatively, you can collect the metrics programmatically by using the metric.Engine API. The back-to-back testing metrics include:

Metric IDMetric Information
slcomp.sil.B2BTestStatusBack-to-Back Test Status for Normal and SIL Mode
slcomp.sil.B2BTestStatusDistributionBack-to-Back Test Status Distribution for Normal and SIL Mode
slcomp.pil.B2BTestStatusBack-to-Back Test Status for Normal and PIL Mode
slcomp.pil.B2BTestStatusDistributionBack-to-Back Test Status Distribution for Normal and PIL Mode

To view the comparison results that the metrics use to determine the status of back-to-back testing, you can use the new function metric.loadB2BResults.

For more information, see Evaluate Status of Back-to-Back Testing for Software Units.
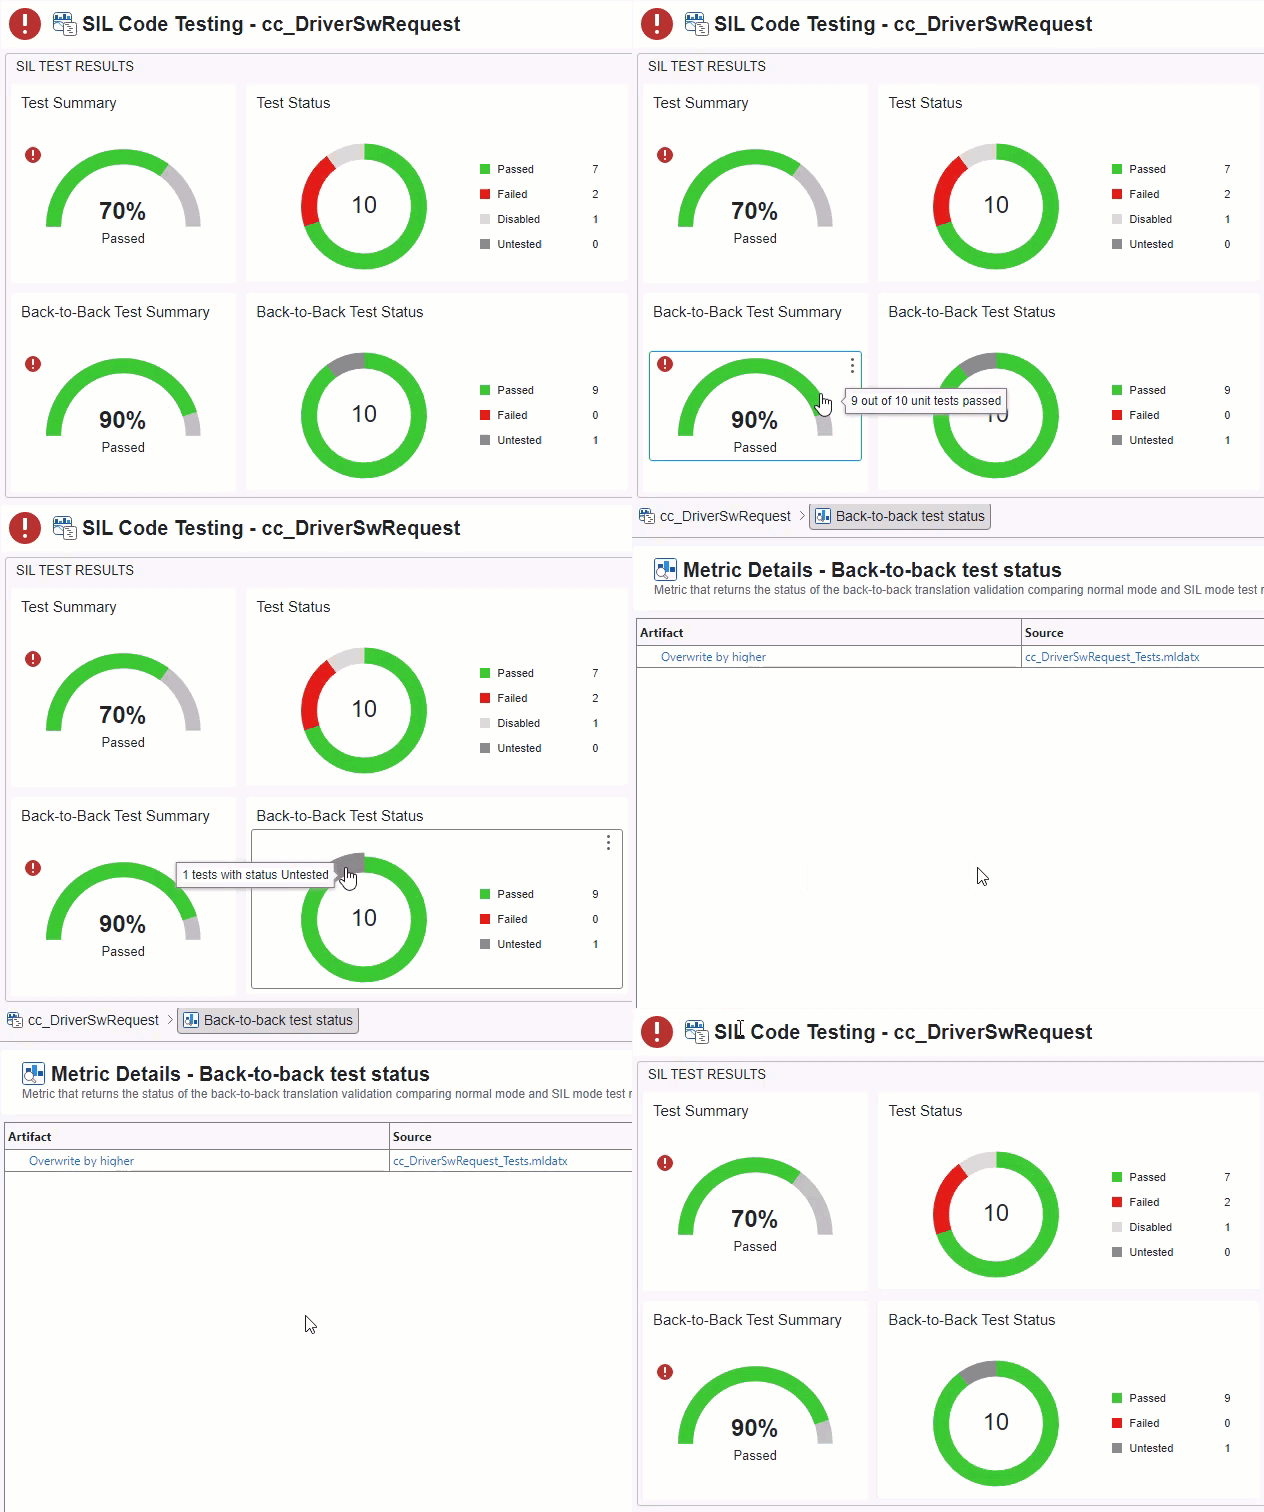
Examination of untested and failed back-to-back metric results

 View Halstead difficulty metrics in the Model Maintainability Dashboard

In R2024a, you can measure the size and complexity of the Simulink models, Stateflow charts, and MATLAB code in your project using the Halstead difficulty metrics. These metrics can help you monitor code quality, identify complex areas in the design, and address software maintainability concerns. You can view the metric results in the Halstead Difficulty widget and Halstead Difficulty Breakdown section in the dashboard.

Alternatively, you can collect the metrics programmatically by using the metric.Engine API. For information on the Halstead difficulty metrics, see Halstead Difficulty Breakdown.
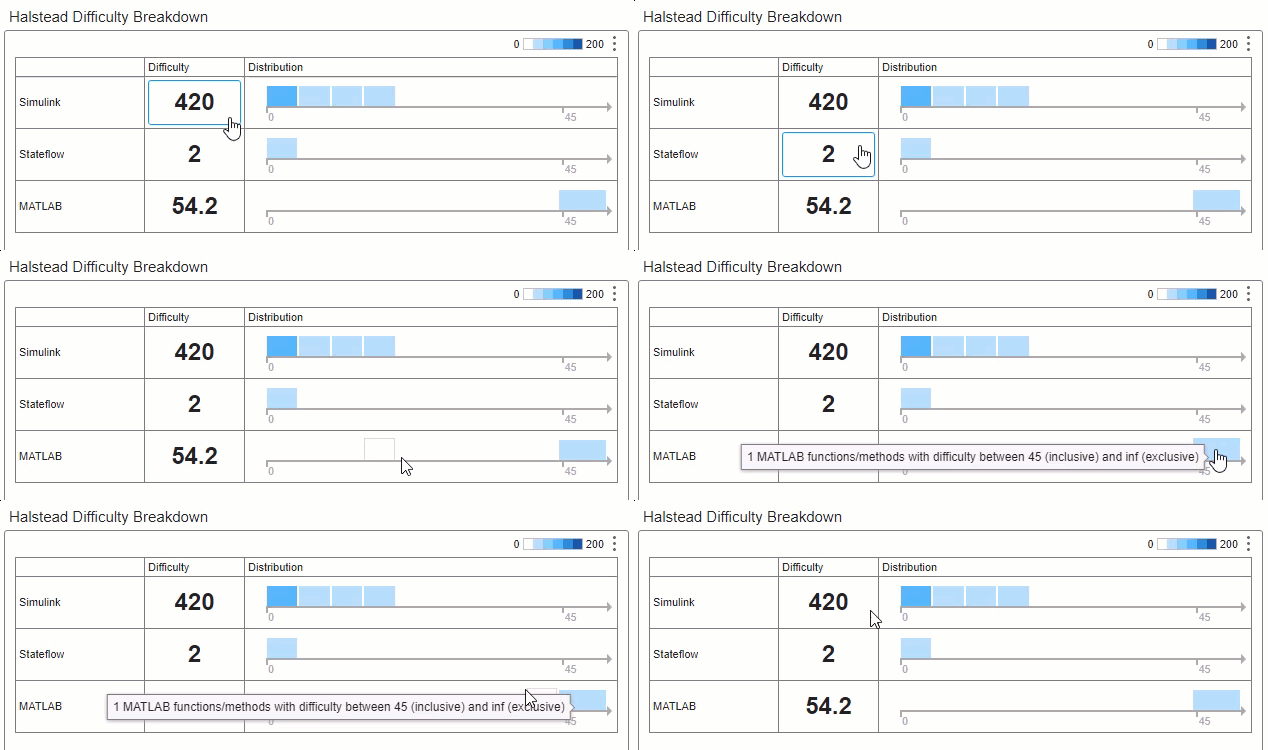
Halstead difficulty and difficulty distributions for Simulink, Stateflow, and MATLAB code

 Reduce digital thread analysis time by caching trace information

In R2024a, you can analyze artifacts and their relationships more efficiently by using the digital thread to cache traceability information in the artifacts themselves. You can enable caching from the Digital Thread Settings dialog box.

When you open a Model Design or Model Testing Dashboard, the dashboard now shows an informational banner where you can open the Digital Thread Settings dialog box by clicking View Digital Thread Settings.

In the Digital Thread Settings dialog box, under User Settings > Trace Information, select Cache trace information to enable caching.

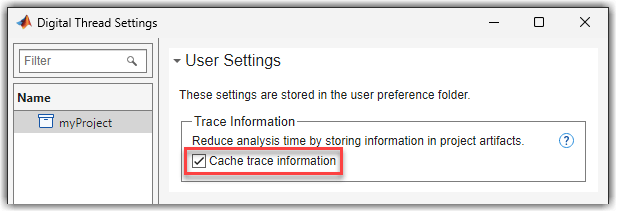
Banner with button for View Digital Thread Settings

Digital Thread Settings showing the Cache trace information checkbox selected

Alternatively, you can view the Digital Thread Settings dialog box for a project by clicking Options in the dashboard toolstrip and clicking Digital Thread Settings. For more information about the digital thread, see Monitor Artifact Traceability and Detect Outdated Results with Digital Thread.

Generate slice for models containing Simulink Functions

Starting 2024a, you can use Model Slicer to generate slice for models containing Simulink Functions. For more information, see Model Slicer Support Limitations for Simulink Blocks.

New JMAAB checks

This table lists the new JMAAB 6.0 checks introduced in R2024a.

Model Advisor CheckCheck ID
Check updates to variables used in state transition conditionsmathworks.jmaab_v6.jc_0741

New High Integrity Systems Modeling checks

This table lists the High Integrity System Modeling checks introduced in R2024a, as well as new check parameters.

Model Advisor CheckCheck IDAddition
Check usage of identical modeling patternsmathworks.hism.hisl_0078New check
Check for invalid root input and output port connectionsmathworks.hism.hisl_0079New check
Check safety-related code generation settings for commentsmathworks.hism.hisl_0038Added configuration parameters Stateflow object comments (Simulink Coder) and MATLAB source code as comments (Simulink Coder) to the check.

Install process for model development and verification directly from Process Advisor app

Starting in R2024a, you can install the support package CI/CD Automation for Simulink Check, and its default model-based development and verification process, directly from the Process Advisor app in the Simulink Apps gallery. Previously, you needed to download and install the support package before you could access the Process Advisor app.

For more information, see Run Tasks Locally and in CI.

Customize Simulink model appearance check action using new input parameters

You can customize the Check for Simulink diagrams using nonstandard display attributes check action by configuring the following input parameters introduced in R2024a.

  • Check if nonscalar signals are selected

  • Check if status bar is selected

  • Check if toolstrip is selected

  • Check if logging and viewers are selected

  • Check if test point is selected

  • Check if base data types are deselected

  • Check if storage class indicator is deselected

  • Check for signal dimension is deselected

  • Check if model browser is deselected

  • Check if execution order is deselected

  • Check if ref. model version is deselected

  • Check if ref. model I/O mismatch is deselected

  • Check if sample time colors are deselected

  • Check if hide library links is selected

  • Check if linearization indicator is selected

  • Check for white background color and black foreground color

  • Check for Zoom 100%

 Functionality being removed or changed

Model Design and Model Testing Dashboards consider each Simulink model as a unit by default

Behavior change

Starting in R2024a, if you do not specify whether a model is a unit or component, the dashboard considers:

  • Simulink models as units, even if the models reference other models

  • System Composer architecture models as components

Previously, by default, the dashboard considered a Simulink model to be a component if it referenced one or more other models.

If you want to specify which models in your project are units and components, label them in your project and configure the dashboard to recognize the label. See Specify Models as Components and Units.

Enable artifact tracing automatically by selecting Enable and Continue

Behavior change

In R2024a, when you open a Model Design or Model Testing Dashboard for the first time in a project, the dashboard requires that you enable artifact tracing, even if you previously enabled artifact tracing for the project. When you open a dashboard, click Enable and Continue to automatically select the artifact tracing setting Track tool outputs in the Digital Thread Settings dialog box.
Enable Artifact Tracing dialog box with link to Digital Thread Settings dialog box

The artifact tracing setting allows the digital thread to generate trace information for output artifacts by allowing the digital thread to use callbacks in other MathWorks tools.

Previously, the setting was in the project settings, in the Manage Project Startup and Shutdown dialog box, under the name Track tool outputs to detect outdated results. That setting and its previous value have been removed. Use the Track tool outputs setting instead.

For more information about the digital thread, see Monitor Artifact Traceability and Detect Outdated Results with Digital Thread.

Metric slcomp.StateflowDecisions returns the total number of Stateflow decisions in a structure with multiple fields

Behavior change

Starting in R2024a, the metric results for slcomp.StateflowDecisions also include the total number of Stateflow decisions in your unit or component.

For each unit and component, the metric returns a metric.Result object where the Value property is a structure with these fields:

  • GraphicalDecisions — Number of graphical decisions

  • MATLABCodeDecisions — Number of MATLAB code decisions

  • TotalDecisions — Total number of Stateflow decisions

Previously, the metric returned Value as a vector where the first element was the number of graphical decisions and the second element was the number of MATLAB code decisions.

This table shows an example of this behavior change.

ExampleResult in R2023b and EarlierResult Starting in R2024a

Open a project and collect the metric results using the metric ID slcomp.StateflowDecisions.

metric_engine = metric.Engine;
execute(metric_engine,"slcomp.StateflowDecisions");
results = getMetrics(metric_engine,"slcomp.StateflowDecisions");
results.Value

The Value in the metric result is a vector with two elements.

ans =

     8
     0

The Value in the metric result is a structure.

ans =

struct with fields:

GraphicalDecisions: 8
MATLABCodeDecisions: 0
TotalDecisions: 8

For information on the metric, see Stateflow Decision Count.

Metric TestCaseTag returns a cell array for test cases that have multiple tags

Behavior change

For test cases that have multiple tags, the metric TestCaseTag returns the value of the metric result as a cell array. Previously, the metric returned the value of the metric result as a character array that contained a comma-separated list of the test case tags.

This table shows an example of this behavior change.

ExampleResult in R2023b and EarlierResult Starting in R2024a

Open a project that contains a test case that uses multiple tags and collect the metric results using the metric ID TestCaseTag.

metric_engine = metric.Engine;
execute(metric_engine,"TestCaseTag");
results = getMetrics(metric_engine,"TestCaseTag");
results.Value

ans =

    'Level2, Normal, Robustness'
ans =

3×1 cell array

{'Level2' }
{'Normal' }
{'Robustness'}

For information on the TestCaseTag metric, see Test Case Tag.

Removed or modified Model Advisor checks

Behavior change

Starting in R2024a, these checks have been removed or modified.

Model Advisor CheckCheck IDDescription
Identify blocks using one-based indexingmathworks.codegen.cgsl_0101Removed check.
Check safety-related block reduction optimization settings mathworks.hism.hisl_0046Removed check.
Check safety-related diagnostic settings for model referencingmathworks.hism.hisl_0310Configuration parameter Invalid root Inport/Outport block connection is no longer supported by the software. To diagnose and fix invalid connections, use Model Advisor check Check for invalid root input and output port connections instead.
Check safety-related model referencing settingsmathworks.hism.hisl_0037Removed configuration parameter Pass fixed-size scalar root inputs by value for code generation from the check.

R2023b

New Features, Bug Fixes, Compatibility Considerations

View compliance status for individual artifacts in the Model Testing Dashboards

In R2023b, the Metric Details section in the Model Testing, SIL Code Testing, and PIL Code Testing Dashboards has a new Status column that shows whether the metric results for individual artifacts are compliant or noncompliant with the metric thresholds. Previously, you could only see the overall status in the overlay icon for a widget. Now, when you click a widget in the dashboard, you can view threshold violations for individual artifacts directly in the Metric Details section.

For example, if you click the Requirements with Tests widget in the Model Testing Dashboard, the Metric Details section shows a Status column with the threshold compliance status for each artifact.
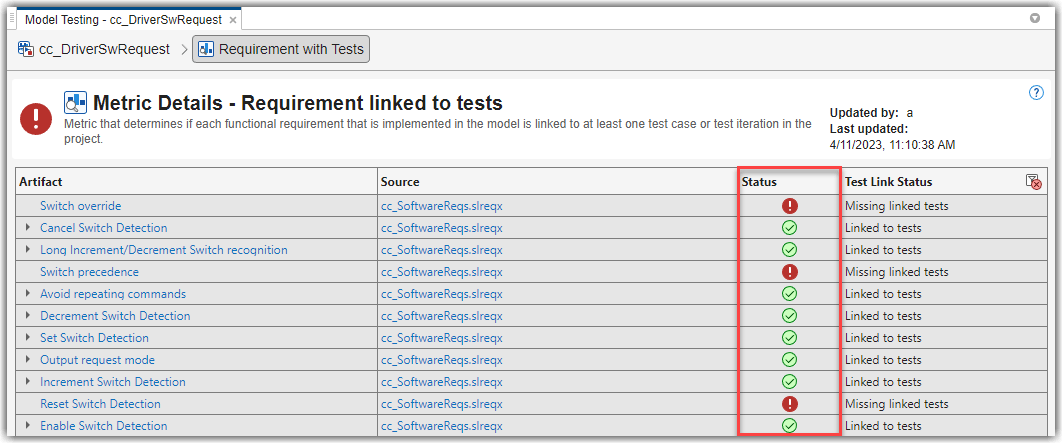
Model Testing Dashboard with Status column showing artifacts with compliant and non-compliant metric results

For an example, see Fix Requirements-Based Testing Issues.

Improved incremental analysis of requirements in the Model Testing Dashboard

In R2023b, the Model Testing Dashboard only considers a requirements metric result as stale if you directly change the requirement or requirement link that the metric analyzes. Previously, when you changed a requirement or requirement link, the Model Testing Dashboard marked any metric results related to the requirement set as stale. Now, the digital thread can track changes to individual requirements and requirement links inside the requirement set.

For more information on the digital thread, see Monitor Artifact Traceability and Detect Outdated Results with Digital Thread.

Open dashboard example project from the documentation or command line

Previously, you ran the script dashboardCCProjectStart to open an example project for the Model Testing and Model Design Dashboards. Starting in R2023b, you must use openExample and openProject to open the dashboard example project instead. For example:

openExample("slcheck/ExploreTestingMetricDataInModelTestingDashboardExample");
openProject("cc_CruiseControl");

Generate report for clone detection results

Starting in R2023b, you can generate a PDF or HTML report of clone detection results. The report shows the clones summary, individual clone groups, and the clone detection configurations used to find clones in a model.

To generate a report, find clones in your model. You then open the Clone Detection Results and Actions pane and click the hyperlinks on the Logs tab. Alternatively, you can use the new function Simulink.CloneDetection.generateReport to generate the report. For more information about clones, see Enable Component Reuse by Using Clone Detection.

Find clones with data type match information

Starting in R2023b, when you find clones using a library file through the clone detector API, the clone detector determines whether the inport data types of the library subsystem matches with the inport data types of the corresponding blocks in the model. Patterns that are graphically the same are considered as clones irrespective of the data types of the blocks. The DataTypeMatch property of the clone detection results Simulink.CloneDetection.Results object indicates whether the subsystem clone matches the inport data types of the library subsystem.

To view the DataTypeMatch property in the clone detection results, create an object of the Simulink.CloneDetection.Settings class, set the DataTypeCheck property of this object to true or 1, then pass this object to the Simulink.CloneDetection.findClones function.

cloneDetectionSettings = Simulink.CloneDetection.Settings();
cloneDetectionSettings = cloneDetectionSettings.addLibraries('clones_library');
cloneDetectionSettings.DataTypeCheck = 1;

cloneResults = Simulink.CloneDetection.findClones('ex_clone_detection', cloneDetectionSettings)
cloneResults =
  Results with properties:
 
          Clones: [1×1 struct]
    ExceptionLog: {}
  

To view the DataTypeMatch, go to CloneList of the results object.

cloneResults.Clones.CloneGroups(1).CloneList{1}
 
  struct with fields:
 
             Name: 'Clone Region 1'
    PatternBlocks: {2×1 cell}
    DataTypeMatch: 1

Clone replacement is not supported if the inport data types of the subsystem in a library do not match with the data types of corresponding inport blocks in the model when the DataTypeCheck property is set to true. For more information, see Identify Data Type Match with Library Clone Detection.

New and updated JMAAB checks to enable edit-time checking and support Stateflow MATLAB charts

In 2023b, these JMAAB checks are modified or newly added.

  • This table lists the new JMAAB 6.0 check that is introduced to include a newly added sub-check that checks for empty signal propagation. It is also supported by edit-time checking.

    Model Advisor CheckCheck ID
    Check signal name propagationmathworks.jmaab_v6.jc_0009

  • This table lists the JMAAB check that is modified to have a new option to flag when default values are changed. By default, it is not selected and the check adheres to JMAAB v5.0. Upon selecting, the check adheres to MAAB v3.0.

    Model Advisor CheckCheck ID
    Check for nondefault block attributesmathworks.maab.db_0140

Updated High Integrity Systems Modeling checks

Starting in R2023b, the check "Check usage of conditionally executed subsystems" (ID: mathworks.hism.hisl_0012) is removed from the Model Advisor. Use Check safety-related diagnostic settings for sample time (ID: mathworks.hism.hisl_0044).

Log information when running Model Advisor checks

Starting in 2023b, when you run Model Advisor from the MATLAB command line, you can log information such as errors, warnings and debug details by using the LogVerbosity option in the ModelAdvisor.run command.

ModelAdvisor.run('vdp',checkIDlist,'LogVerbosity','None')

To specify the level of detail of the logging, you can set the LogVerbosity option as shown:

Value of LogVerbosityLevel of Information Logging

None

No information (default value).

Concise

Moderate amount of information like errors and warnings.

Verbose

Complete information.

Additionally, you can include the LogFile option to save the log details to a text file.

ModelAdvisor.run('vdp',checkIDlist,'LogVerbosity','Concise','LogFile','Log.txt')

MISRA check to identify variant blocks that do not have a default choice

This table lists the new check that has been introduced under MISRA C:2012 Coding Standards checks. It checks for variant blocks with startup variant activation time that do not have a default choice when the Casting modes is set to Standards Compliant. Refer Casting modes for further information.

Model Advisor CheckCheck ID
Check for variant blocks that do not have a default choicemathworks.misra.DefaultChoiceVariantChecks

Filter to display edit-time checks removed from Model Advisor Configuration Editor

In R2023b, the filter to display only the edit-time supported checks is removed from the Library pane of the Model Advisor Configuration Editor. The Model Advisor Configuration Editor continues to display the edit-time checks with other checks.

 Functionality being removed or changed

IsInformer and IsViolation properties will be removed

The IsInformer and IsViolation properties for the ModelAdvisor.ResultDetail class will be removed in a future release. Starting in R2023b, Model Advisor checks that use IsInformer and IsViolation issue a warning in the MATLAB Command Window. Specify the severity of Model Advisor check results by using the property ViolationType instead.

This example shows how to specify that a Model Advisor check result is informational using the recommended functionality.

FunctionalityUse This Instead
resultObj = ModelAdvisor.ResultDetail;
resultObj.IsInformer = true;
resultObj = ModelAdvisor.ResultDetail;
resultObj.ViolationType = "info";

This example shows how to specify that a Model Advisor check result is a warning using the recommended functionality.

FunctionalityUse This Instead
resultObj = ModelAdvisor.ResultDetail;
resultObj.IsViolation = true;
resultObj = ModelAdvisor.ResultDetail;
resultObj.ViolationType = "warn";

For more information, see ModelAdvisor.ResultDetail class.

Simulink.MdlAdvisorCheck and Simulink.MdlAdvisorTask classes will be removed

Warns

Simulink.MdlAdvisorCheck and Simulink.MdlAdvisorTask classes will be removed in a future release. Use the ModelAdvisor.Check and ModelAdvisor.Group classes instead to create Model Advisor checks and Model Advisor groups, respectively.

R2023a

New Features, Bug Fixes, Compatibility Considerations

CI/CD Automation for Simulink Check (March 2023; Version 23.1.5)

The support package CI/CD Automation for Simulink Check now supports R2023a.

In R2023a, you can analyze artifacts in referenced projects and view artifact warnings and errors in the Project Analysis Issues pane.
Project Analysis Issues at bottom of Process Advisor app

To download and install the support package, see CI/CD Automation for Simulink Check.

SIL and PIL Code Testing Dashboards: Assess the status of code testing and coverage for compliance to standards like ISO 26262

Assess the status and quality of your code testing by using the metric results in the SIL Code Testing dashboard and PIL Code Testing dashboard. The metrics measure different aspects of code testing completeness for software-in-the-loop (SIL) and processor-in-the-loop (PIL) tests. The metrics are based on industry-recognized standards such as ISO 26262 and DO-178C.

Use the dashboards to view the:

  • Compliance status of SIL and PIL test results and coverage

  • Detailed test status breakdowns

  • Comparisons to relevant model testing results and coverage

Based on the metric results, you can identify and fix failing test results, gaps in coverage, and anomalies between model and code testing results. The dashboard widgets show a summary of the testing metric data for a software unit. To explore the data in more detail, click an individual widget. A table lists the artifacts in the unit and their results for the metric. The table provides hyperlinks to open each artifact so that you can view details about the artifact and address testing quality issues. For more information, see View Status of Code Testing Activities for Software Units in Project and Identify and Troubleshoot Gaps in Code Testing Results and Coverage.
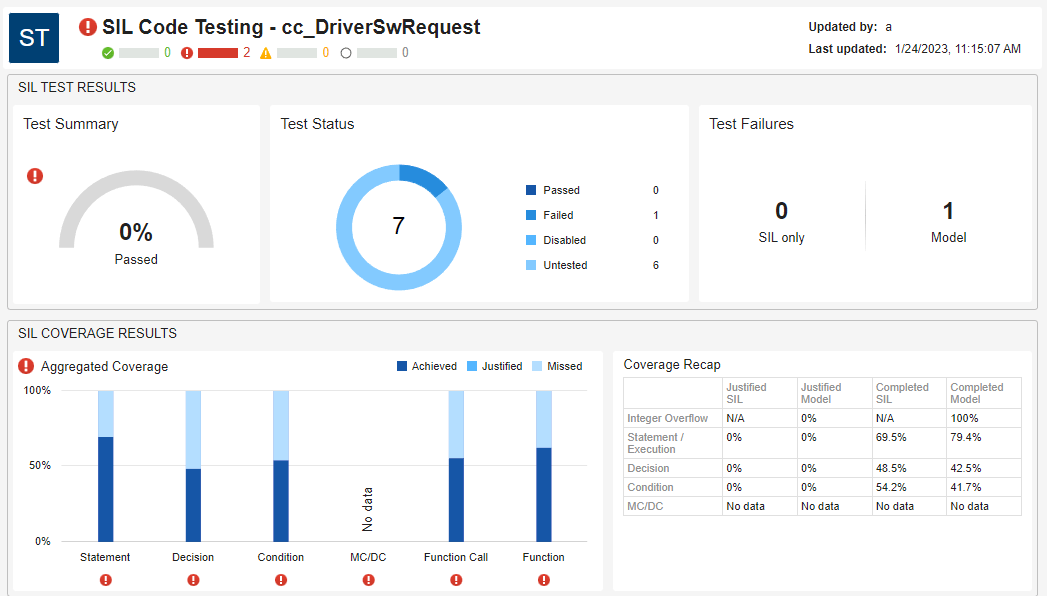
SIL Code Testing Dashboard showing 70% of SIL tests passing and incomplete SIL coverage

You can also collect the metrics programmatically by using the same metric API as the Model Testing Dashboard. For more information, see metric.Engine.

Viewing the metric results data and details in the dashboard requires a Simulink Check license. To collect results for a metric, you must have the licenses required to edit the associated artifacts, such as Simulink Test and Simulink Coverage™. For more information on the metrics and the required licenses, see Code Testing Metrics.

Explore traceability relationships for design artifacts, requirements, tests, and results in the dashboards

In R2023a, the dashboards provide additional and improved trace views that help you visually explore traceability information in a project. A trace view is an interactive diagram that shows a certain preset of traceability information for artifacts in a project. The trace views provide a detailed, tree-like structure of project artifacts and show trace relationships, individual artifact information, and a hierarchical view of trace relationships between the artifacts in the selected unit or component.

Previously, you could only see the traceability path from a specific artifact to its unit or component when you right-clicked the artifact and clicked View trace to dashboard.

Now, there are three different types of trace views for units and components:

  • Design Dependency — Shows the library blocks, data dictionaries, model references, and MATLAB files that trace to the unit or component

  • Requirement to Design — Shows the functional requirements that trace to the unit or component

  • Tests and Results — Shows the test cases and test results that trace to the unit or component
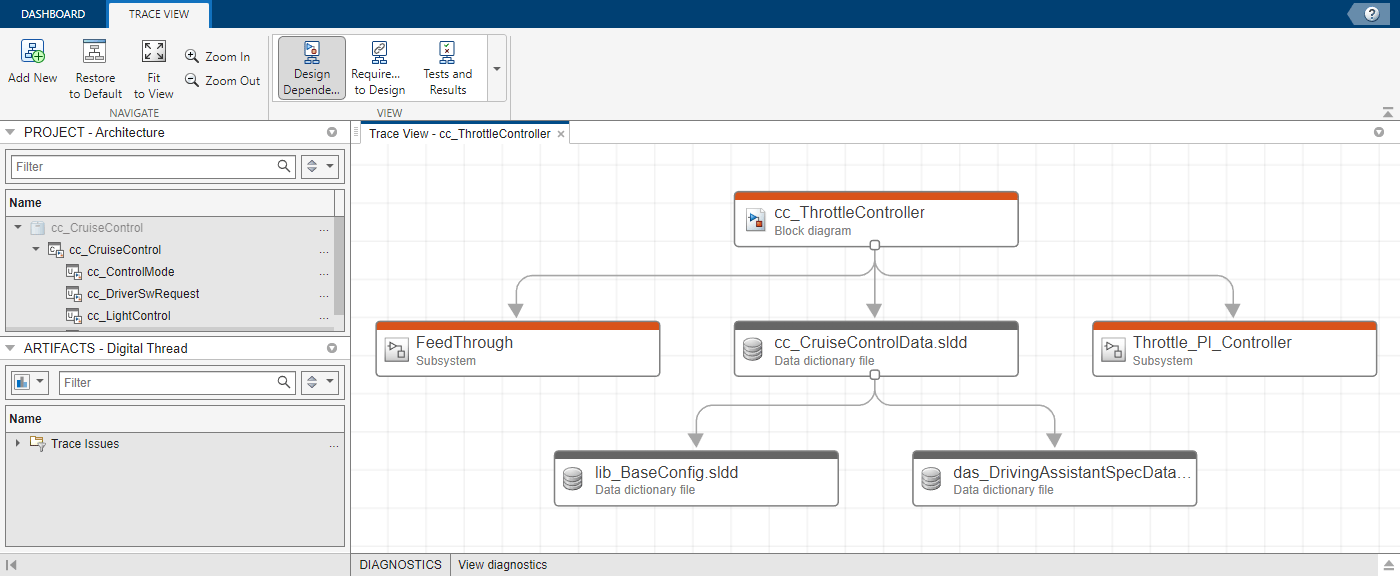
Trace View for the unit db_ThrottleController showing dependencies on design artifacts

For more information, see Explore Traceability Information for Units and Components.

Analyze artifacts from referenced projects in the dashboards

In R2023a, the dashboards can analyze artifacts in referenced projects. The dashboards automatically analyze artifacts across project references and trace artifacts from a referenced project to the current project.

The Project panel now shows units and components in the current project and in referenced projects. Artifacts from referenced projects appear in the Artifacts panel for the relevant unit or component that they trace to in the project. The dashboard includes these referenced project artifacts in the metric results.

To see the name and path of the project that contains an artifact, point to the artifact and view the tooltip.
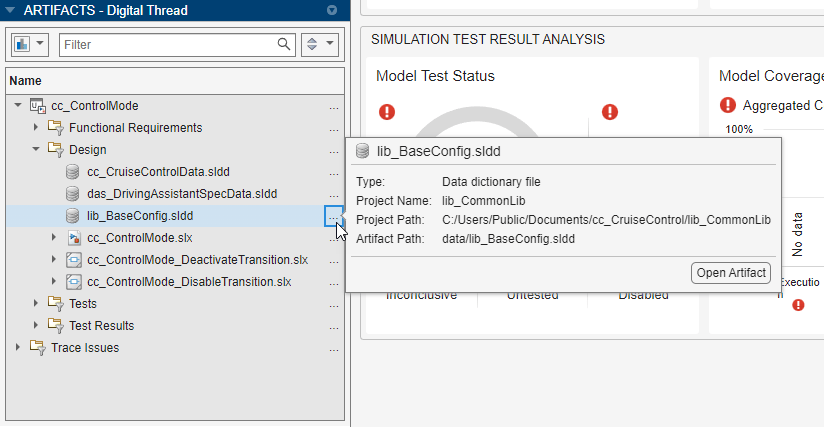
Tooltip that shows the project name and path for a referenced artifact

You can also see artifacts from referenced projects in a trace view. For more information, see Explore Traceability Information for Units and Components.

Trace requirement links to MATLAB code files in the Model Testing Dashboard

In R2023a, the Model Testing Dashboard traces links between requirements and MATLAB code files. Previously, the dashboard did not support requirement links to MATLAB code files and the links did not contribute to the metric results.

For information on how to link requirements to MATLAB code, see Requirements Traceability for MATLAB Code. If you expect a requirement link to trace to a unit in the dashboard and it does not, see Resolve Missing Artifacts, Links, and Results.

Troubleshoot artifact issues with Artifact Issues tab in the dashboards

In R2023a, you can use the Artifact Issues tab to identify and fix artifact issues in your project and troubleshoot warnings and errors. Artifact issues no longer appear in the Diagnostics panel. The issues now appear in the Artifact Issues tab and persist between MATLAB sessions.

To view artifact issues in the current project, open the Artifact Issues tab by clicking the Artifact Issues button in the dashboard toolstrip. In the Artifact Issues tab, a table displays detailed information about each artifact issue in the project.

Artifact Issues tab showing a warning about model callbacks

Alternatively, you can use the new function getArtifactIssues on a metric engine object to return a list of the artifact issues the dashboard detects in the project.

For more information, see View Artifact Issues in Project and getArtifactIssues.

View integer overflow coverage in the Model Testing Dashboard

In R2023a, the Model Testing Dashboard shows integer overflow coverage, Int. Overflow, in the Model Coverage section of the dashboard.
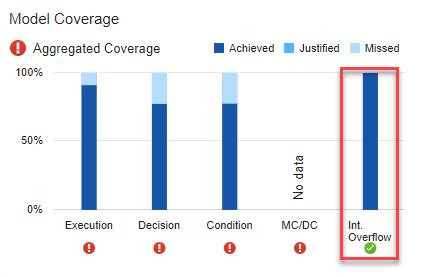
Model Coverage bar chart with new Int. Overflow bar outlined in red

You can also programmatically collect integer overflow coverage with the metric ID slcomp.mt.CoverageBreakdown. The metric value returns a structure array with a field OverflowSaturation for the integer overflow coverage. For example:

metric_engine = metric.Engine;
execute(metric_engine,"slcomp.mt.CoverageBreakdown");
res = getMetrics(metric_engine,"slcomp.mt.CoverageBreakdown");
overflowCoverage = res(1).Value.OverflowSaturation
overflowCoverage = 

  struct with fields:

               Achieved: 100
              Justified: 0
                 Missed: 0
    AchievedOrJustified: 100

For more information, see Model Coverage Breakdown.

View individual test iterations in the metrics and dashboards

Previously, if a test case included multiple iterations, the dashboard and metric results reflected the status of the whole test case and did not show individual iteration results. In R2023a, the dashboards and metrics can show the results for individual tests. A test can be either:

  • A test iteration

  • A test case without iterations

For example, if the Untested widget in the Model Testing Dashboard shows 6 untested unit tests, these tests can be:

  • 6 untested test iterations

  • 6 untested test cases without iterations

  • A combination of test iterations and test cases without iterations
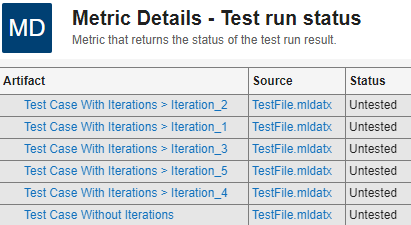
Metric Details showing individual test iterations and a test case without iterations

In the Artifacts panel, in the Tests and Test Result folders, the dashboard now shows test iterations in the test file hierarchy.

Additionally, in the Metric Details, you can point to an artifact to view a tooltip with the:

  • Location of the artifact in the project hierarchy

  • Artifact type

  • Project name

  • Project path

  • Artifact path relative to the project root
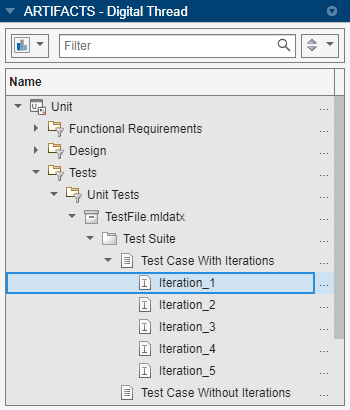
Artifacts panel showing a test file that contains a test case with iterations and a test case without iterations

For an example, see Explore Status and Quality of Testing Activities Using Model Testing Dashboard.

Faster response time for finding clones in a model

Starting in R2023a, the clone detection algorithm significantly shortens the amount of time a findClones function takes to search for clones across the model. This is particularly visible for larger models. The optimized clone detection algorithm performs better with both the Clone Detector app and Simulink.CloneDetection.findClones API.

For more information, see Find Clones Across the Model.

Load a specific justifications file when running Model Advisor checks

Previously, the Model Advisor only loaded justifications for a model if the justifications file was named modelname_justifications.json and was in the current working directory. In R2023a, you can load a justifications file with any name and from any directory.

The first time that you justify a check for a model, the Model Advisor prompts you with a Save As dialog that allows you to save the justifications file with your specified file name and in your specified file directory.

You can load a justifications file for a model by using either of these approaches:

  • In the Model Advisor toolstrip, click Open > Load Justifications File and select a justifications file.

  • When you call ModelAdvisor.run, use the Justifications argument to specify the filename or path to a justifications file.

For more information, see Justify Model Advisor Violations from Check Analysis and ModelAdvisor.run.

JMAAB 6.0 Support: New and updated Model Advisor checks to enable compliance with JMAAB 6.0 modeling style guidelines

In R2023a, the Model Advisor is updated to support the new JMAAB 6.0 modeling guidelines. While a new folder containing JMAAB 6.0 checks is added in the Model Advisor, MAB 5.0 and JMAAB 5.1 checks continue to be available as before.
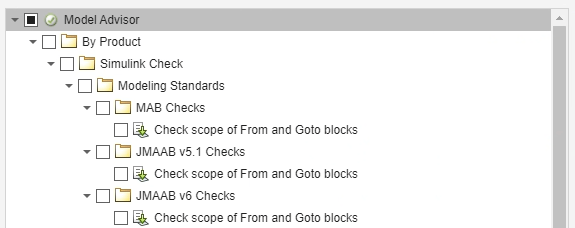
Model Advisor window displaying results for a particular check across MAB 5.0, JMAAB 5.1 and JMAAB 6.0 version folders.

The JMAAB 6.0 checks are derived from the JMAAB v6.0 modeling guidelines composed by the Japan MATLAB® Automotive Advisory Board.

This table lists the new JMAAB 6.0 checks.

Model Advisor CheckCheck ID

Check bus and enumeration data type names

mathworks.jmaab_v6.jc_0900

Check length of bus and enumeration data type names

mathworks.jmaab_v6.jc_0901

Check arrowhead size of transition lines

mathworks.jmaab_v6.jc_0902

Check for prohibited overlapping or intersecting blocks and signal lines

mathworks.jmaab_v6.jc_0903

Check for prohibited overlapping of states and transition lines in Stateflow charts

mathworks.jmaab_v6.jc_0904

Check data names in MATLAB Functions

mathworks.jmaab_v6.jc_0905

Check the length of data names in MATLAB Functions

mathworks.jmaab_v6.jc_0906

Check size of junctions

mathworks.jmaab_v6.jc_0907
Check description of execution statementsmathworks.jmaab_v6.mp_0007
Check for spaces between function or variable names and left parenthesis symbolmathworks.jmaab_v6.mp_0008

Check for operator precedence

mathworks.jmaab_v6.mp_0010

Check spaces in expressions

mathworks.jmaab_v6.mp_0011

Check description of conditional expressions

mathworks.jmaab_v6.mp_0022

Check relational operators usage

mathworks.jmaab_v6.mp_0023

Check function headers

mathworks.jmaab_v6.mp_0032

Check number of lines of functions

mathworks.jmaab_v6.mp_0034

Check for utilization of the return value of functions

mathworks.jmaab_v6.mp_0040

Check array indices

mathworks.jmaab_v6.mp_0046

Check for usage of nonempty statements

mathworks.jmaab_v6.mp_0047

Check folder names

mathworks.jmaab_v6.ar_0002
Check signal line connectionsmathworks.jmaab_v6.db_0032
Check position of signal labels mathworks.jmaab_v6.db_0097
Check definition of Stateflow datamathworks.jmaab_v6.db_0125
Check for MATLAB expressions in Stateflow chartsmathworks.jmaab_v6.db_0127

Check for Stateflow transition appearance

mathworks.jmaab_v6.db_0129

Check usable characters for parameter names

mathworks.jmaab_v6.jc_0232

Check usage of floating-point expressions in Stateflow charts

mathworks.jmaab_v6.jc_0481

Check usage of Discrete-Time Integrator block

mathworks.jmaab_v6.jc_0627

Check settings for data ports in Multiport Switch blocks

mathworks.jmaab_v6.jc_0630

Check type setting by data objects

mathworks.jmaab_v6.jc_0644

Check Output data type of operation blocks

mathworks.jmaab_v6.jc_0651

Check condition actions and transition actions in Stateflow

mathworks.jmaab_v6.jc_0753

Check placement of Label String in Transitions

mathworks.jmaab_v6.jc_0770

Check for usage of events and broadcasting events in Stateflow charts

mathworks.jmaab_v6.jm_0012

Check scope of From and Goto blocks

mathworks.jmaab_v6.na_0011

Check for missing ports in Variant Subsystems

mathworks.jmaab_v6.na_0020

The remaining checks are included as part of JMAAB 6.0, with no change to the check behavior.

Analyze Simulink functions using Model Slicer

You can now analyze models that contain Simulink functions using Model Slicer. You can also visualize the input or output dependency of a function caller block by adding the block as a starting point. For more information, see Analyze Models Containing Simulink Functions Using Model Slicer.

Simulink Check features available in Simulink Online

Simulink Check is now available in Simulink Online. You can access most of the features through your web browser.

Limitations

  • Metrics Dashboard is not supported in Simulink Online.

  • Model Advisor parallel run is not supported in Simulink Online.

 Functionality being removed or changed

New metric IDs for test status and coverage metrics in the Model Testing Dashboard

Behavior change

Starting in R2023a, there are new metric IDs associated with the test status and coverage metrics in the Model Testing Dashboard. If you use the previous metric IDs, update your code to use the new metric IDs.

Previous metric IDNew metric IDMetric updates
TestCaseStatusslcomp.mt.TestStatusThe metric has a new metric ID, but has the same functionality. For more information, see Model Test Status.
TestCaseStatusDistributionslcomp.mt.TestStatusDistributionThe metric has a new metric ID, but has the same functionality. For more information, see Model Test Status Distribution.
ExecutionCoverageBreakdownslcomp.mt.CoverageBreakdownYou can now use a single metric ID to collect the aggregated coverage results for a unit. The metric value returns results in a structure array that you can use to access the coverage results for each coverage type. For more information, see Model Coverage Breakdown.
DecisionCoverageBreakdown
ConditionCoverageBreakdown
MCDCCoverageBreakdown
ExecutionCoverageFragmentslcomp.mt.CoverageFragmentYou can now use a single metric ID to collect the coverage results for each model in a unit. The metric value returns results in a structure array that you can use to access the coverage results for each coverage type. For more information, see Model Coverage Fragment.
DecisionCoverageFragment
ConditionCoverageFragment
MCDCCoverageFragment

To return the metrics from the Model Testing Dashboard, use the getAvailableMetricIds function:

modelTestingMetrics = getAvailableMetricIds(metric_engine,...
App="DashboardApp",Dashboard="ModelUnitTesting");

In the new metric IDs, slcomp refers to Simulink components and mt refers to model testing. For more information, see Model Testing Metrics.

Metric IDs removed for percentage results in the Model Testing Dashboard

Starting in R2023a, there are no longer individual metric IDs for the percentage results in the Model Testing Dashboard. Instead, access the percentage results directly from the associated distribution metric. The distribution metric value contains a structure array with a field Ratios that contains an integer vector for the percentage results.

Previous metric IDAssociated distribution metric IDDescription
TestCaseStatusPercentageslcomp.mt.TestStatusDistribution

The Ratios field of slcomp.mt.TestStatusDistribution returns:

  • Ratios(1) — Percentage of model tests that failed.

  • Ratios(2) — Percentage of model tests that passed.

  • Ratios(3) — Percentage of model tests that are disabled.

  • Ratios(4) — Percentage of model tests that are untested.

For more information, see Model Test Status Distribution.

TestCaseWithRequirementPercentageTestCaseWithRequirementDistribution

The Ratios field of TestCaseWithRequirementDistribution returns:

  • Ratios(1) — Percentage of model tests missing links to requirements.

  • Ratios(2) — Percentage of model tests with links to requirements.

For more information, see Test Case with Requirement Distribution.

RequirementWithTestCasePercentageRequirementWithTestCaseDistribution

The Ratios field of RequirementWithTestCaseDistribution returns:

  • Ratios(1) — Percentage of requirements missing links to model tests.

  • Ratios(2) — Percentage of requirements with links to model tests.

For more information, see Requirement with Test Case Distribution.

For example, if your previous code was:

execute(metric_engine,["TestCaseStatusPercentage",...
"TestCaseWithRequirementPercentage",...
"RequirementWithTestCasePercentage"]);

Update to this code:

execute(metric_engine,["slcomp.mt.TestStatusDistribution",...
"TestCaseWithRequirementDistribution",...
"RequirementWithTestCaseDistribution"]);
When you get the metric results, the percentage results are in the integer vector Ratios.

Suppose that 14.29% of tests fail, 71.43% of tests pass, 14.29% of tests are disabled, and 0% of tests are untested. The metric slcomp.mt.TestStatusDistribution returns Ratios as an integer vector with the percentages in decimal form:

results = getMetrics(metric_engine,"slcomp.mt.TestStatusDistribution");
results.Value.Ratios
ans =

    0.1429
    0.7143
    0.1429
         0

For more information on the Ratios field, see the associated distribution metric:

metric.Result objects no longer return the fields Type and ParentType

Starting in R2023a, metric.Result objects do not return the fields Type and ParentType for the properties Artifacts and Scope.

If you use the Type or ParentType fields from the Artifacts and Scope properties of metric.Result objects, update your code to remove references to those fields.

Check hisl_0311: "Check safety-related diagnostic settings for Stateflow" no longer checks for the use of machine-parented data

Behavior change

Starting in R2023a, Model Advisor check "Check safety-related diagnostic settings for Stateflow" (mathworks.hism.hisl_0311) no longer checks that the configuration parameter Use of machine-parented data instead of Data Store Memory is set to none or warning because the configuration parameter has been removed.

Note that the configuration parameter was removed because Stateflow charts no longer support machine-parented data. You can check for machine-parented data and use the Upgrade Advisor to convert machine-parented data to chart-parented data store memory. For more information, see Consult the Upgrade Advisor and Check for machine-parented data.

R2022b

New Features, Bug Fixes, Compatibility Considerations

CI/CD Automation for Simulink Check (October 2022; Version 22.2.2)

The support package CI/CD Automation for Simulink Check now supports R2022b Update 1 and later updates. The support package provides tools to help you integrate your model-based process into a Continuous Integration and Continuous Deployment (CI/CD) system.

The support package provides:

  • A customizable process modeling system to define your build and verification process

  • A build system that can automatically generate and efficiently execute a process in your CI system

  • The Process Advisor app for deploying and automating your prequalification process

  • Integration with common CI systems

You can use the support package to help you set up a model-based design pipeline, reduce build time, reduce build failures, debug build failures, and deploy a consistent build and verification process.

For more information, see Run Tasks Locally and in CI. To download and install the support package, see CI/CD Automation for Simulink Check.

Model Maintainability Dashboard: Assess the complexity and maintainability of your design across the model development lifecycle

In R2022b, you can assess the size, architecture, and complexity of your design by using the metric data in the new Model Maintainability Dashboard. The metrics measure different aspects of model maintainability from model design artifacts like Simulink models, Stateflow charts, and MATLAB code. The model maintainability metrics help you determine if parts of a design are too complex and need to be refactored. A less complex design is easier to read, maintain, and test.

Use the Model Maintainability Dashboard to collect and explore maintainability metric data. The dashboard displays metric results related to the component structure, interface ports and signals, design cyclomatic complexity, and software architecture. For an example of how to use the Model Maintainability Dashboard, see Monitor the Complexity of Your Design Using the Model Maintainability Dashboard.
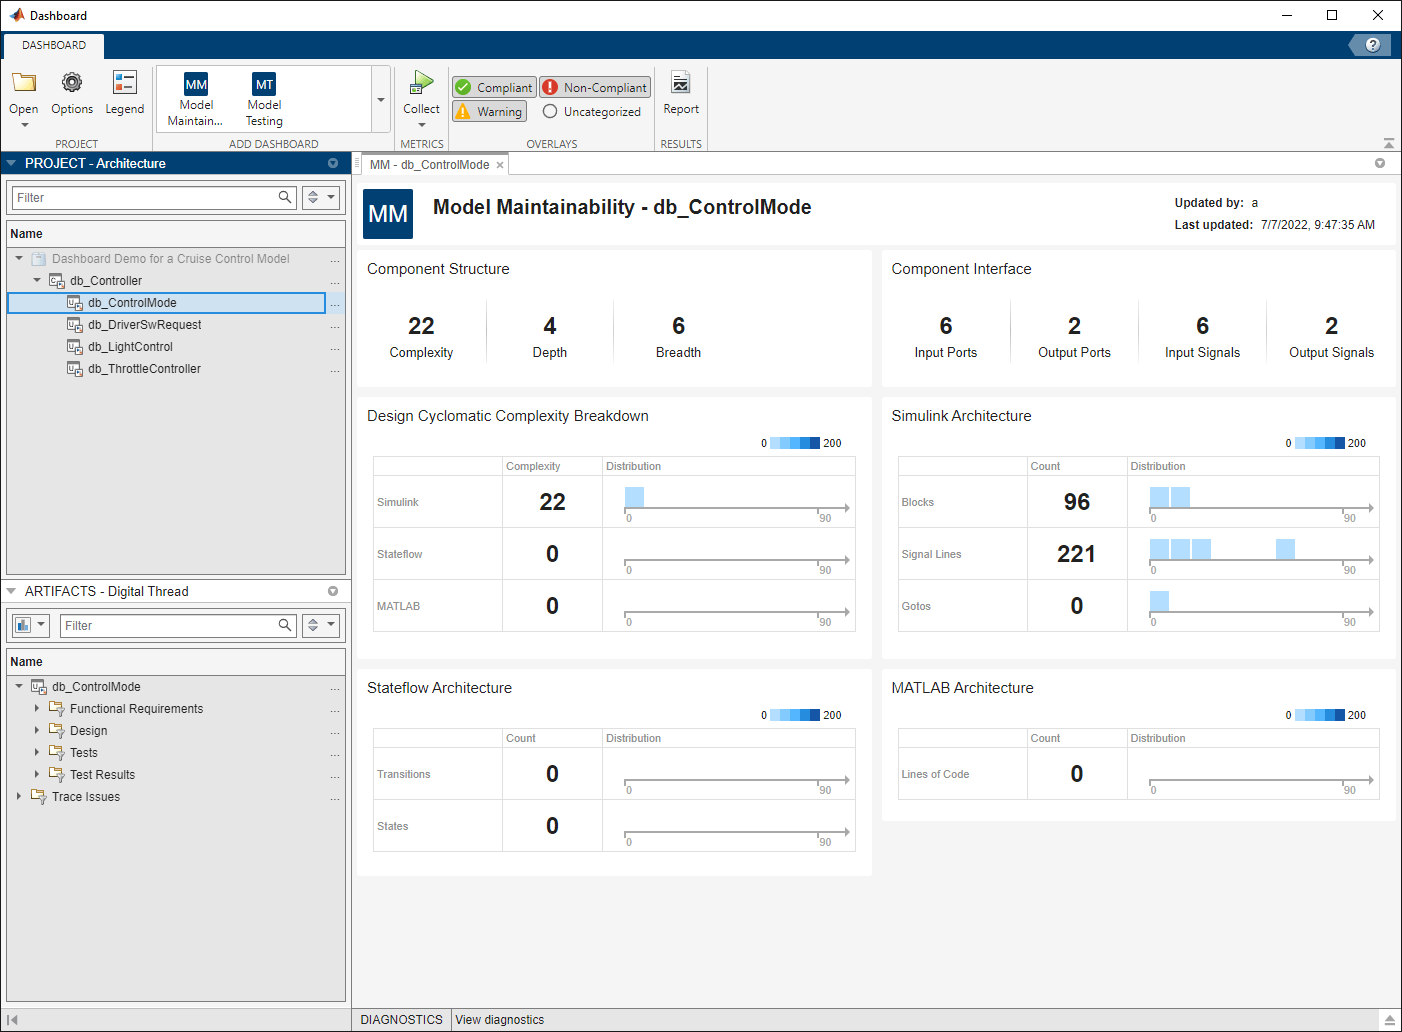
Model Maintainability Dashboard for a software unit

You can also collect the metrics programmatically by using the functions associated with the metric.Engine object. This is the same metric API used to programmatically collect metrics for the Model Testing Dashboard. When you use it to programmatically collect metrics for the Model Maintainability Dashboard, specify the Dashboard argument as "ModelMaintainability". For more information, see Collect Model Maintainability Metrics Programmatically.

View external MATLAB code associated with units and components in the Model Maintainability Dashboard

In R2022b, the Model Maintainability Dashboard displays external MATLAB code associated with the units and components in your project. The dashboard displays external MATLAB code such as MATLAB functions, methods, and classes stored in MATLAB files. The code files appear in the Design folder of the Artifacts panel.

For example, if you have a unit that uses an Interpreted MATLAB Function block to call the function saved in the file myExternalFunction.m, the file appears in the Artifacts panel in the Design folder when you select your unit in the Project panel.

If you expect external MATLAB code to appear in the dashboard and it does not, see External MATLAB Code Missing from Artifacts Panel.

Navigation enhancements for the Model Testing Dashboard and new Model Maintainability Dashboard

Previously, in the Model Testing Dashboard, you used the Artifacts panel both to select which unit to open the dashboard for and to explore the artifacts that traced to the units and components in the project.

In R2022b, the dashboard selection and artifact exploration are in separate panels:

  • The Project panel shows the architecture of the software units and components in the current project. The dashboard displays metric results for the unit or component you select in the Project panel. If a dashboard is not available for a specific unit or component, the name of the unit or component appears dimmed.
    Project pane with several units and components

  • The Artifacts panel shows the Functional Requirements, Design, Tests, and Test Results folders, which contain the artifacts the dashboard traced to the current unit or component selected in the Project panel. For example, the Design folder for a unit might show the data dictionary, model, and subsystem references associated with the unit.
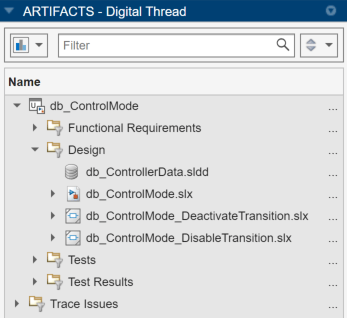
    Artifacts panel showing design artifacts for the unit db_ControlMode

For more information, see Monitor the Complexity of Your Design Using the Model Maintainability Dashboard and Explore Status and Quality of Testing Activities Using Model Testing Dashboard.

Identify the sources of overall achieved coverage in the Model Testing Dashboard

In R2022b, identify the types of tests that contribute to your overall achieved coverage in the Model Testing Dashboard. The dashboard identifies the percentage of the overall achieved coverage coming from requirements-based tests or unit-boundary tests, including execution, decision, condition, and modified condition / decision coverage. Requirements-based tests link to at least one requirement. Unit-boundary tests test the whole unit, not just lower-level subsystems.

Industry-recognized software development standards recommend using requirements-based, unit-boundary tests to confirm the completeness of coverage. Verify the tests that contribute to your overall achieved coverage with the dashboard metric data. In the Model Testing Dashboard, in the Simulation Test Result Analysis section, there is a new subsection, Achieved Coverage Ratio, with two new widgets: Requirements-Based Tests and Unit-Boundary Tests.
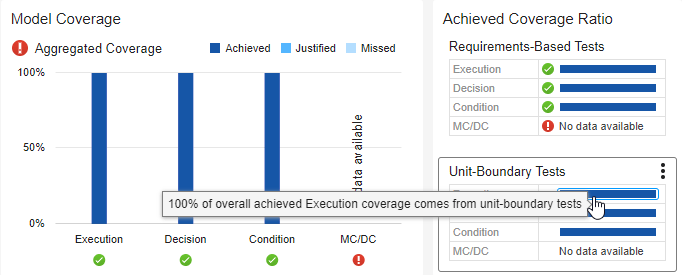
Unit-Boundary Tests widget shows 100% of overall achieved Execution coverage comes from unit-boundary tests

Additionally, you can use the functions associated with the metric.Engine object to programmatically collect the achieved coverage ratio metrics.

For more information on the new metrics for overall achieved coverage from requirements-based and unit-based tests, see:

For more information, see Monitor Low-Level Test Results in the Model Testing Dashboard.

View internal and external test harnesses in the Model Testing Dashboard

In R2022b, the Model Testing Dashboard displays internal and external test harnesses in the Artifacts panel. Previously, the dashboard showed only externally stored test harnesses.

To view the test harnesses associated with a unit, go to the Artifacts panel and expand the folders Tests > Test Harnesses.

If you expect a test harness to appear in the dashboard and it does not, see Resolve Missing Artifacts, Links, and Results in the Model Testing Dashboard.

Generated report opens automatically for the Model Testing Dashboard and Model Maintainability Dashboard

When you generate a report for your metric results, the generated report now opens automatically.

You can specify whether the report opens when you generate a report by using one of these methods:

  • In the Model Testing Dashboard or Model Maintainability Dashboard, click the Report button on the toolstrip. In the Create Metric Result Report dialog box, in the Output Options section, select or clear the Launch Report check box.

  • Use the generateReport function and specify the LaunchReport argument as true or false.

High-Integrity Systems Modeling Checks: Improve quality and compliance with guidelines​​​​

In R2022b, you can use these high-integrity modeling checks:

For more information, see Model Checks for High Integrity Systems Modeling.

​​​​Use older Model Advisor configuration files in newer versions of MATLAB

From R2022b, you can upgrade an older Model Advisor customization configuration file to the latest version of MATLAB. This enables you to view and use newly introduced or updated input parameters and check IDs. You can also delete checks that are no longer supported.

When you load an older configuration file that contains checks which are incompatible with the current release, you will get a dialog box asking whether you want to automatically fix issues in the configuration. To automatically fixes issues and produce a validation summary, click Yes. To open the Model Configuration Editor with check issues highlighted, click No. You can then fix issues and validate the configuration from within the Model Advisor Configuration Editor. You can fix issues for each individual check or globally fix issues by clicking the Validate button. For more information, see Upgrade Incompatible Checks in Model Advisor Configuration Files.

Identify clones in a model during edit time

Simulink Check now identifies clones in models from the linked library file during edit time. This edit time check detects and highlights clones of Simulink blocks that can help you identify clone patterns earlier in the model design process.

To enable this check, in the Modeling tab, in the Evaluate & Manage section, click Model Advisor > Configuration Editor. Under the Simulink Check product, select the Identify clones from linked library file check box and click Apply.

You can also use Model Advisor to refactor the identified clones. Under the Simulink Check product in Model Advisor, select the Identify clones from linked library file check box and click the Run button from the Model Advisor toolstrip. The Model Advisor Report displays the identified clones. Click the Fix button to refactor the model.

For more information on edit-time checking, see Check Model Compliance Using Edit-Time Checking.

Identify Bus Selector and Bus Creator blocks during edit time

Simulink Check now detects Bus Selector and Bus Creator blocks in your model. To simplify your model, it is recommended to use In Bus Element and Out Bus Element blocks instead of Bus Selector blocks for inputs and Bus Creator blocks for outputs. For more information, see Simplify Subsystem and Model Interfaces with Bus Element Ports.

In the Modeling tab, in the Evaluate & Manage section, click Model Advisor > Configuration Editor. Under the Simulink Check product, select the Refactor to simplify bus element blocks check box and click Apply. This enables the edit time check to identify Bus Selector and Bus Creator blocks.

You can also use Model Advisor to refactor the identified Bus Selector and Bus Creator blocks. Under the Simulink Check product in Model Advisor, select the Refactor to simplify bus element blocks check box and click the Run button from the Model Advisor toolstrip. The Model Advisor Report displays the identified candidates. Click the Fix button to refactor the model.

For more information on edit-time checking, see Check Model Compliance Using Edit-Time Checking.

Enhancements to edit-time checking for numeric efficiency issues

You can now identify numeric efficiency issues earlier in the model design process by using edit-time checking. In R2022b, when you use edit-time checking, you can view violations of the Check usage of 'long long' data type (Embedded Coder) Model Advisor check. For more information, see the check documentation.

Add bus elements as starting points using Model Slicer

In R2022b, for bus signals, along with adding an entire bus hierarchy as a starting point, you can now select individual bus elements from the Select Bus Element(s) user interface using the Model Slicer context menu. You can also use the addStartingPoint function to specify a bus element path as an input.

To add a bus as a starting point:

  1. Open the model in Model Slicer

  2. Right-click the bus signal and select Model Slicer > Add Bus as Starting Point

To add bus elements as starting points:

  1. Open the model in Model Slicer

  2. Right-click the bus signal and select Model Slicer > Select Bus Elements as Starting Points

  3. From the Select Bus Element(s) dialog box, select the elements that you want to add as starting points and then click Add Starting Point

  4. Close the Select Bus Element(s) window

The selected bus and bus elements show up under Starting Points in the Model Slicer configuration window.

For more information, see addStartingPoint and removeStartingPoint.

 Functionality being removed or changed

Metrics Dashboard user interface, metricdashboard function, and slmetric package API will be removed

Warns

The Metrics Dashboard user interface, metricdashboard function, slmetric package API, and corresponding customizations will be removed in a future release. In R2022b, use the Model Maintainability Dashboard and metric package API to collect size, architecture, and complexity metrics.

The Metrics Dashboard:

  • Can only run on individual models

  • Requires a computationally intensive, compile-based analysis for many metrics

The Model Maintainability Dashboard and metric package API:

  • Runs on individual models in a project, but can also aggregate metrics across software units in software components

  • Analyzes and traces dependencies between project files such as Simulink models, MATLAB code, and Stateflow objects

  • Identifies outdated metric results

For the Model Maintainability Dashboard to analyze a model, the model needs to be stored in a project. MATLAB projects can help you organize models and interact with source control. For information on how to store your models in a project, see Create Projects. For information how to use the Model Maintainability Dashboard to collect size, architecture, and complexity metrics, see Monitor the Complexity of Your Design Using the Model Maintainability Dashboard and Collect Model Maintainability Metrics Programmatically.

Replace instances of "RequirementsBasedModelUnitTesting" with "ModelUnitTesting"

Previously, the Dashboard argument for the getAvailableMetricIds function accepted the values:

  • "ModelUnitTesting" — Returned only the model testing metric identifiers that are not associated with requirements metrics.

  • "RequirementsBasedModelUnitTesting" — Returned each of the model testing metric identifiers, including requirements metrics.

Now the Dashboard argument for the function getAvailableMetricIds accepts these values:

  • "ModelUnitTesting" — Return the metric identifiers associated with the Model Testing Dashboard for your project.

    The function getAvailableMetricIds uses your project options to determine which model testing metrics to return. getAvailableMetricIds can either return each of the model testing metrics, including requirements metrics, or return only the model testing metrics that are not associated with requirements metrics. To change your Project Options, open the Model Testing Dashboard and click Options in the toolstrip. In the Layout section, select or clear Hide requirements metrics and click Apply. For more information, see Hide Requirements Metrics in the Model Testing Dashboard and in API Results.

  • "ModelMaintainability" — Return the metric identifiers associated with the Model Maintainability Dashboard.

FunctionalityUse This Instead

When you used the syntax getAvailableMetricIds(metric_engine,App="DashboardApp",Dashboard="RequirementsBasedModelUnitTesting");, the function returned each of the metrics used by the Model Testing Dashboard for the metric engine object metric_engine.

If you want to return metrics from the Model Testing Dashboard, you must update your code:

Specify the Dashboard argument as "ModelUnitTesting".

testingMetrics = getAvailableMetricIds(metric_engine,...
App="DashboardApp",Dashboard="ModelUnitTesting");

For more information, see getAvailableMetricIds.

Check hisf_0007: Usage of Junction Conditions(maintaining mutual exclusions) will be removed

The hisf_0007: Usage of Junction Conditions(maintaining mutual exclusions) will be removed as it is covered under hisl_0101.

R2022a

New Features, Bug Fixes, Compatibility Considerations

 Toolstrip-based UI for Model Advisor​​​​

The Model Advisor user interface now includes simplified toolstrip with new features.

  • Filter Checks - Filters the checks based on their respective result statuses, such as Failed, Passed, Justified.

  • Justify - Justify the violations. Justifications allow you to add a rationale for violations observed during Model Advisor analysis. For more information, see Justify Violated Blocks from the Model Advisor Check Analysis.

  • Fix - Fixes the violations by setting the violated parameter values to recommended values.

  • Reports - Export Model Advisor analysis reports in HTML, PDF, and DOCX formats.

  • Manage Configurations - Create, load, restore, and associate configurations in simple workflows.

This table describes the changes to the menu items in the Model Advisor:

Previous UI ElementNew UI ElementDescription of the Change
Run Selected ChecksRun ChecksNo change in functionality. Use this button to run selected checks.
Settings > (options)Open > (options)Some older options are no longer available. Use this button to open or customize Model Advisor Configuration Editor.
Generate Report…Report > (options)No change in functionality. Use this button to generate the Model Advisor analysis report in HTML format. Use the drop-down option to selectPDF or WORD.
Configure Hidden input parametersConfigure input parameters in Model Advisor Configuration EditorConfigure hidden input parameters was a hyperlink in the check window. In R2022a, you can now click the Configure input parameters in Model Advisor Configuration Editor icon ().
Edit > Send Check IDs to WorkspaceRight-click on any check, and select Send Check IDs to Workspace.Use this option to send check IDs to workspace.
Edit > Send Instance IDs to WorkspaceRight-click on any check, and select Send Instance IDs to Workspace.Use this option to send instance IDs to workspace.

This table describes the navigation options removed from Model Advisor:

Navigation Options Removed
Settings > Treat as referenced model
Settings > Preferences
Edit > Reset
Switch to Model Advisor Dashboard
Run Checks in Background
Highlighting check results
Highlight exclusion results
Highlighting

For more information, see Run Model Advisor Checks and Review Results.

Model Advisor Check Result Statuses​​​​

Model Advisor analysis now have new statuses to better understand the check results. This table describes the existing and new check statuses:

Check Result Status

IconDescription

Passed

Pass icon when the flag for checks result is set to warning

Model does not have any violations for the given check or checks.

Failed

Fail icon

Check has identified severe violations.

Warning

Warning icon

Check has identified violations.

Justified

justification icon

Check violations are justified.

Not Run

Not Run icon

Check not selected for Model Advisor analysis.

Incomplete

Incomplete icon

Check analysis is incomplete or check execution has resulted in exceptions.

For more information, see Run Model Advisor Checks and Review Results.

Author Model Advisor checks that run at edit-time

Starting in R2022a, you can author Model Advisor checks that run during edit-time. Because edit-time checks appear in the model canvas while you edit your model, they can help you catch issues earlier in the model design process. You can author edit-time checks that detect and highlight issues on blocks and signals.

To create a custom edit-time check, create a MATLAB class that derives from the ModelAdvisor.EdittimeCheck class. For an example, see Define Edit-Time Checks to Comply with Conditions that You Specify with the Model Advisor.

If you have a System Composer license, you can author custom edit-time checks that run on architecture models. For an example, see Define Custom Edit-Time Checks that Fix Issues in Architecture Models.

For more on the workflow for authoring custom checks, see Define Custom Model Advisor Checks.

Model Advisor disables edit-time checks with high execution times

In R2022a, the Model Advisor now disables custom edit-time checks with long execution times. The Model Advisor automatically disables custom edit-time checks if, in the current MATLAB session, the execution time of the check exceeded 500 milliseconds in at least three different models. This feature helps prevent custom edit-time checks from negatively impacting performance as you edit your model.

If the Model Advisor disables a custom edit-time check, it displays a warning on the Simulink canvas. You can re-enable the edit-time check by either:

  • Clicking the hyperlink text in the warning.

  • Passing the check identifier, checkID, to the function edittime.enableCheck:

    edittime.enableCheck(checkID)

To prevent a custom edit-time check from being disabled, author the check so that the check executes in less than 500 milliseconds on your models.

For more information, see Define Edit-Time Checks to Comply with Conditions that You Specify with the Model Advisor.

Create help for custom Model Advisor checks​​​​

You can define help files for your custom Model Advisor checks to make the checks easier to use. Custom help files allow you to verify the check capabilities and avoid potential warnings in the model. You can point the custom check help to a PDF or an HTML page of your choice. To link your custom documentation:

  1. Open the sl_customization.m file.

  2. Use setHelp() on the check or group object created in the sl_customization.m file.

    setHelp('format','webpage','path','custom_path');
    

    The supported name-value arguments are:

    Format - "webpage", "pdf"

    Path - Path of the user-defined help page or document

    Example:

    checkObj = ModelAdvisor.Check('SimplePassFailCheck');
    checkObj.setHelp('format','webpage','path','custom_path');

  3. Close the sl_customization.m file.

  4. Refresh the customizations by entering:

    Advisor.Manager.refresh_customizations

To view the custom help, right-click the custom checks or the folder and click What's This?.

For More information, see setHelp | setHelp | Create Help for Custom Model Advisor Checks.

Justify Model Advisor check violations​​​​

You can now justify and hide the Model Advisor check violations from Model Advisor check report using the justifications workflow. To justify a violation, use either of the following options:

  • For violations displayed post Model Advisor check analysis:

    1. From the check selector section, click on the violated check(s).

    2. Click Justify icon from the toolstrip.

    3. Enter the rationale for justification in the Justifications field on the Result Inspector tab.

    4. Click Add Justification.

  • For edit-time violations:

    1. On the Simulink canvas, hover over a violated block.

    2. Click on the warning icon displayed above the violated block.

      Violation summary is displayed along with the title of the violated check.

    3. Click Suppress. A description field to enter rationale is displayed.

    4. Enter rationale for the justification.

    5. Click Add Comment.

For More information, see Justify Violated Blocks from the Model Advisor Check Analysis.

 High-Integrity Systems Modeling Checks: Improve quality and compliance with guidelines ​​​​

In R2022a, you can use these high-integrity modeling checks:

For more information, see Model Checks for High Integrity Systems Modeling.

 Compatibility Considerations

These checks were removed in R2022a:

Model Advisor CheckCorresponding Modeling Guideline

Check usage of bitwise operations in Stateflow charts.

Use Check usage of bit operation blocks (ID: mathworks.hism.hisl_0019)

hisf_0003: Usage of bitwise operations

Check for Strong Data Typing with Simulink I/Ohisf_0009: Strong data typing (Simulink and Stateflow boundary)

 MAB Checks: Improve quality and compliance with guidelines ​​​​

 Compatibility Considerations

These checks were removed in R2022a:

Model Advisor CheckCorresponding Modeling Guideline
Check for Strong Data Typing with Simulink I/Odb_0122: Stateflow and Simulink interface signals and parameters

Enable edit-time checking for models by using new configuration parameter

In R2022a, you can use the new configuration parameter ShowAdvisorChecksEditTime to enable edit-time checking for a model.

In the Modeling tab, in the Evaluate & Manage section, click Model Advisor > Edit-Time Checks. In the Model Advisor pane of the Configuration Parameter dialog, select the check box for Edit-Time Checks and click Apply.

Alternatively, you can enable or disable edit-time checking for your model by using edittime.setAdvisorChecking.

For more information, see Show Model Advisor edit-time checks.

Associate a Model Advisor configuration file with a model

In R2022a, you can associate a Model Advisor configuration file with your model. In previous releases, you set a default configuration for all models. You can now specify a different Model Advisor configuration file for each model. For Model Advisor configuration files created in a previous release, open and re-save the configuration file in the R2022a Model Advisor Configuration Editor before associating the file with a model.

For more information, see Load and Associate a Custom Configuration with a Model.

Enable artifact tracing to track changes and project artifacts in the Model Testing Dashboard

In R2022a, you can enable artifact tracing directly in the settings for your project. This feature allows you to set up your project to track changes to project artifacts, such as test results from Simulink Test, to detect outdated metric results.

By default, the Model Testing Dashboard prompts you to enable artifact tracing the first time you open a project in the dashboard. Click Enable and Continue to track tool outputs to detect outdated metric results.

You can also enable artifact tracing from the Manage Project Startup and Shutdown dialog box. In your project, in the Project tab, click Startup Shutdown. In the Manage Project Startup and Shutdown dialog box, select Track tool outputs to detect outdated results.

For more information, see Enable Artifact Tracing for the Project.

Include subsystem-level tests in the Model Testing Dashboard

In R2022a, the Model Testing Dashboard includes subsystem-level tests, such as tests on atomic subsystems, in the metric results. Previously, the dashboard metric results included only test cases that ran on the whole unit.

The dashboard metrics now include tests defined on:

  • Atomic subsystems

  • Atomic subsystem references

  • Atomic Stateflow charts

  • Atomic MATLAB Function blocks

  • Referenced models

Note that the Model Testing Dashboard cannot calculate aggregated coverage for units that only have test results at the subsystem level. In order for the dashboard to display aggregated test coverage for a unit, the unit needs to have results from top-level tests executed by the model.

For more information, see Include Subsystem-Level Test Results in the Model Testing Dashboard.

Trace System Composer architecture models in the Model Testing Dashboard

In R2022a, you can use the Model Testing Dashboard to specify System Composer architecture models as components. The architecture models, and the units that trace to the models, appear in a hierarchy in the Artifacts panel.

Supported architectures include System Composer architecture models, System Composer software architecture models, and AUTOSAR architectures.

To add a supported architecture to the Model Testing Dashboard, label the models as components in your project and configure the Model Testing Dashboard to recognize the labels. For more information, see Specify Models as Components and Units.

View test harnesses in the Artifacts panel for each unit in the Model Testing Dashboard

In R2022a, the Model Testing Dashboard organizes tests in a new hierarchy in the Artifacts panel, with a folder called Tests that includes the subfolders Unit Tests, Others, and Test Harnesses. The subfolder Test Harnesses contains externally stored test harnesses that trace to the unit or unit subsystems.

You can open a test harness directly from the Model Testing Dashboard by expanding Test Harnesses and double-clicking the name of the test harness.

If your model already uses internal test harnesses, you can convert the internal test harnesses to an externally stored test harness. Navigate to the top of the main model and open Simulink Test. On the Tests tab, click Manage Test Harnesses > Convert to External Harnesses. Click Yes to convert the affected test harnesses.

For more information, see Manage Requirements-Based Testing Artifacts for Analysis in the Model Testing Dashboard.

Hide requirements metrics in the Model Testing Dashboard

In R2022a, you can view the Model Testing Dashboard without the widgets associated with requirements metrics. If you do not use requirements-based testing, this new layout can help you focus on the dashboard widgets that contribute to your design goals. The new layout shows only the widgets for Test Case Breakdown, Model Test Status, and Model Coverage.

To use this layout, open the Project Options dialog box. In the Project section, click Options. In the Layout section of the Project Options dialog box, select Hide requirements metrics and click Apply.

The Hide requirements metrics setting is saved in the project meta information and is shared with everyone who uses the project. If you use this layout, the function generateReport generates a filtered report that shows only metric results that are not associated with requirements metrics.

For more information, see Hide Requirements Metrics in the Model Testing Dashboard and in API Results.

Identify which artifacts contribute to metrics in the Model Testing Dashboard

In R2022a, the Artifacts panel includes new folders and subfolders that indicate which artifacts contribute to the metric results.

The Artifacts panel shows folders for each main artifact type: Functional Requirements, Design, Tests, and Test Results. In each folder, the artifacts that contribute to the metric results are in one subfolder and the artifacts that do not contribute to metric results are in a different subfolder. For example, in the folder Tests, the subfolder Unit Tests contains the test cases that the dashboard uses in the metrics for the unit. The subfolder Others contains the test cases that trace to the unit, but that the dashboard does not include in the metrics for the unit. For more information, see Manage Requirements-Based Testing Artifacts for Analysis in the Model Testing Dashboard.

The folder Untraced Artifacts is now called Trace Issues and contains subfolders to help you to troubleshoot why the dashboard cannot trace the artifacts. The folder Trace Issues contains the subfolders Unexpected Implementation Links, Unresolved and Unsupported Links, Untraced Tests, and Untraced Results. Additionally, the dashboard diagnostic messages now include a hyperlink to the affected artifact file and a suggestion for how to address the issue. If you have errors or warnings in the Diagnostics pane, click the hyperlink to open the affected artifact and use the suggested action to address the issue. For more information, see Fix Requirements-Based Testing Issues.

Detect changes to artifact traceability and metric results in the Model Testing Dashboard

In R2022a, the Model Testing Dashboard automatically performs initial artifact tracing and shows warning banners to help you detect changes to artifact traceability and metric results.

When you open an existing project in the Model Testing Dashboard, you no longer need to click Trace Artifacts or Trace and Collect All. The dashboard automatically traces artifacts in the project and, when you select a unit, the dashboard collects any uncollected metrics for the unit.

As you make changes to the artifact files in your project, the dashboard detects the changes and automatically traces the artifacts to refresh the data in the Artifacts panel.

Additionally, if artifacts in the project change after you collect the results, the dashboard shows a warning banner to indicate that the metric results are outdated. The Stale icon also appears on dashboard widgets that might show outdated results. Click the Collect button on the warning banner to re-collect the metric data and to update the stale widgets with data from the current artifacts.

For more information, see Explore Status and Quality of Testing Activities Using the Model Testing Dashboard.

Navigate between project artifacts in the Model Testing Dashboard

In R2022a, you can more easily navigate between widgets and data shown in the Model Testing Dashboard. At the top of the dashboard, there is now a breadcrumb trail that you can use to navigate from Metric Details to the dashboard for the associated unit. When you click a widget in the dashboard, the dashboard opens the Metric Details and shows a breadcrumb trail from the Metric Details (MD) back to the Model Testing (MT) results in the unit dashboard. Click the name of the unit, for example db_DriverSwRequest, to return to the Model Testing dashboard.

Additionally, when you open the Requirements Editor, you can now navigate to the Model Testing Dashboard by using a button in the toolstrip of the Requirements Editor. In the Requirements Editor, in the Analysis section, click Model Testing Dashboard.

For more information, see Fix Requirements-Based Testing Issues.

Refactor similar clones across the model

In R2022a, you can refactor similar clones anywhere across the model programmatically or by using Detect clones across model property in the Clone Detector app. In R2021b, you could refactor only exact clones across the model.

For more information, see Find Clones Across the Model.

Find clones by using multiple external library files

Prior to R2022a, you could search for clones in Simulink models from only a single existing library file at a time. Starting in R2022a, you can find clones by using the multiple library files in the models.

To detect clones by using external library files in Clone Detector app, click Settings > Match Patterns with Libraries and select the library files. Alternatively, you can use a Simulink.CloneDetection.Settings object to add library files to find clones programmatically.

Note

You can refactor exact clones only identified from library files.

For more information, see Identify and Replace Clones in Model Libraries.

Clone Detection Exclusion Editor improvements

You can now use the Clone Detection Exclusion Editor to:

  • Highlight excluded blocks by clicking Block Full Path.

  • Edit exclusions.

  • Edit exclusion reason (Rationale).

  • Delete multiple rows at a time.

For more information, see Exclude Components from Clone Detection.

Inspect test cases generated in Simulink Design Verifier by using Model Slicer

You can now use Model Slicer to inspect test cases generated through test generation analysis. Model Slicer supports these test case objective statuses:

  • Objectives Satisfied

  • Objectives Satisfied - Needs Simulation

  • Objectives Satisfied by Existing Testcases

  • Objectives Undecided with Testcases

  • Objectives Undecided due to Runtime Error

When you set the Model coverage objectives parameter to Enhanced MCDC in the Configuration Parameters window and perform test generation analysis, then open Model Slicer, you can choose a configuration by setting Slice configuration list to:

  • Configuration to inspect Enhanced MCDC objective detectability

  • Configuration to inspect test generation objective

To launch Model Slicer after running a test generation analysis, in the Results window, click Inspect. For more information, see Inspect Enhanced MCDC Objectives using Model Slicer (Simulink Design Verifier).

Debug equivalence tests by using Model Slicer

You can now use the Model Slicer in the Simulink Test Test Manager to debug equivalence tests. You can also debug tests that compare two simulation modes if one of the modes is set to Normal. For information on using the Model Slicer in the Test Manager, see Debugging Equivalence Test Failures Using Model Slicer (Simulink Test).

CI/CD Automation for Simulink Check (August 2022; Version 22.1.0)

In R2022a, the support package CI/CD Automation for Simulink Check provides tools to help you integrate your model-based process into a Continuous Integration and Continuous Deployment (CI/CD) system.

The support package provides:

  • A customizable process modeling system to define your build and verification process

  • A build system that can automatically generate and efficiently execute a process in your CI system

  • The Process Advisor app for deploying and automating your prequalification process

  • Integration with common CI systems

You can use the support package to help you set up a model-based design pipeline, reduce build time, reduce build failures, debug build failures, and deploy a consistent build and verification process.

For more information, see https://www.mathworks.com/matlabcentral/fileexchange/115220.

 Functionality being removed or changed

getAvailableMetricIds function returns metrics from the Model Testing Dashboard app and Design Cost Estimation app

Behavior change

The function getAvailableMetricIds now returns metrics from the Model Testing Dashboard app and Design Cost Estimation app if either of these conditions exists:

  • You specify 'Installed' as false.

  • You have Fixed-Point Designer™ installed on your machine.

FunctionalityUse This Instead
When you used the syntax getAvailableMetricIds(metric_engine), the function returned only the metrics used by the Model Testing Dashboard app for the metric engine object metric_engine.

If you have Fixed-Point Designer installed on your machine but you want to return metrics from only the Model Testing Dashboard app, you must update your code:

Specify the 'App' as 'DashboardApp' and the 'Dashboard' as 'RequirementsBasedModelUnitTesting'.

metrics = getAvailableMetricIds(metric_engine,...
'App','DashboardApp',...
'Dashboard','RequirementsBasedModelUnitTesting');

For more information, see getAvailableMetricIds.

ModelAdvisor.CheckResult returns different values for the property status

Behavior change

In R2022a, the ModelAdvisor.CheckResult object returns different values for the status property.

Previously, valid values for the status property were the character vector values:

  • 'Fail'

  • 'Not Run'

  • 'Pass'

  • 'Warn'

In R2022a, valid values for the status property are the enumerated values:

  • Failed

  • Incomplete

  • Justified

  • NotRun

  • Passed

  • Warning

If you use the status property of a ModelAdvisor.CheckResult object, you may need to update your code:

Previous status ValueCurrent status Value
'Fail'Failed
'Not Run'NotRun
'Pass'Passed
'Warn'Warning

For more information, see ModelAdvisor.CheckResult.

Avoid using process callback functions

Still runs

A process callback function is a function that configures the Model Advisor and processes check results. In R2022a and later releases, avoid using process callback functions. Remove process callback functions from your sl_customization.m files.

To configure the Model Advisor without a process callback function, use the Model Advisor Configuration Editor to create a custom configuration file, then use a default configuration or a model configuration to set the startup configuration. For more information, see Use the Model Advisor Configuration Editor to Customize the Model Advisor and Load and Associate a Custom Configuration with a Model.

To process check results without a process callback function, open the Model Advisor and click Report to generate a report for the check results. You can click a check in the Model Advisor, and then open the Results and Results Details tabs to view the check results. You can also use ModelAdvisor.run to collect and view check results.

R2021b

New Features, Bug Fixes, Compatibility Considerations

View compliance status of metrics in the Model Testing Dashboard

In R2021b, you can now use overlays in the Model Testing Dashboard to see if your testing artifacts comply with standard requirements-based testing practices. The overlays show if the metric results for a widget are compliant, non-compliant, or generate a warning that the metric results should be reviewed. Results are compliant if they show full traceability, test completion, or model coverage.

To see the overlays for a compliance category, select the category in the Overlays section of the dashboard toolstrip. The overlay appears on the widgets that have results in that category and the top right of the dashboard shows the number of widgets in each compliance category.
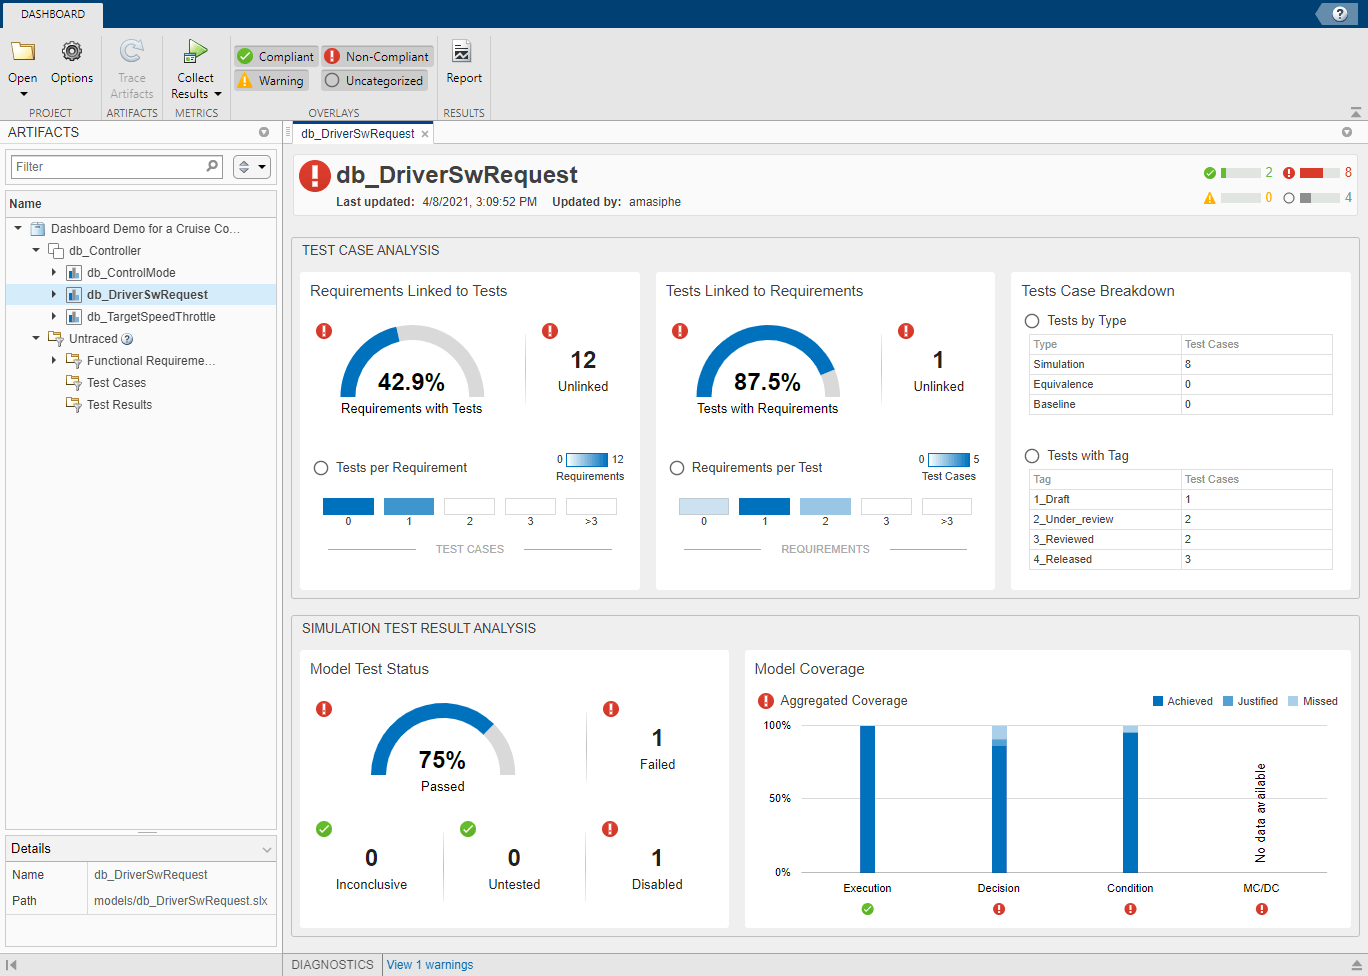
Model Testing Dashboard showing results that are marked compliant, non-compliant, and uncategorized.

To see the compliance thresholds for a metric, point to the overlay icon in the widget.
Failed widget with the cursor placed on the non-compliant icon. The tooltip above the icon shows the failed status and the result that one test failed. The tooltip shows that the compliance threshold is zero failed tests and any other value is non-compliant.

You can hide the overlay status icons by deselecting the overlays in the toolstrip.

For more information on the compliance thresholds for each metric, see Model Testing Metrics.

Organize models using unit testing hierarchy in the Model Testing Dashboard

In R2021b, the Model Testing Dashboard organizes the models in a new hierarchy, with component models at the top of the hierarchy and unit models at the bottom of the hierarchy. The new hierarchy helps you to locate the models that require unit testing so you can assess their testing quality using the dashboard. The Model Testing Dashboard provides metric results for only the unit models.

By default, the Model Testing Dashboard defines models in two ways:

  • Models that do not reference other models are units.

  • Models that reference one or more models are components.

Alternatively, you can specify a model as a unit or a component by using labels in your project.

In the example below, the Artifacts pane shows that the component model db_Controller references the unit models db_ControlMode, db_DriverSwRequest, and db_TargetSpeedThrottle.
Artifacts pane showing the model db_Controller expanded to show the referenced models db_DriverSwRequest, db_ControlMode, and db_TargetSpeedThrottle.

Expand a unit to see the artifacts that trace to it, organized by artifact type. For more information, see Categorize Models in a Hierarchy as Components or Units.

Additionally, if you collect metric results programmatically, the metric.Result object has the new property CollectionScope, which describes the unit for which you collect metric results.

Measure pass and fail criteria metrics in the Model Testing Dashboard

In R2021b, you can use the new metrics Test cases with pass/fail criteria and Test cases with pass/fail criteria distribution to assess the quality of your requirements-based tests. The metrics determine if each test case contains pass/fail criteria such as verify statements, verification blocks, custom criteria, and logical or temporal assessments. Requirements-based tests should verify the functionality of your model using one or more of these criteria. Use the metrics to find and address tests that do not include pass/fail criteria.

To run the new metrics, in the Model Testing Dashboard, click Collect Results. In the Simulation Test Result Analysis section, the Inconclusive widget shows the number of tests that do not include pass/fail criteria.

Alternatively, to run the metrics programmatically, use the execute function for a metric.Engine object and specify the identifiers TestCaseVerificationStatus and TestCaseVerificationStatusDistribution. For more information, see Collect Metrics on Model Testing Artifacts Programmatically.

Added functions for programmatically analyzing requirements-based testing metrics

In R2021b, you can now use the function updateArtifacts to run the traceability analysis for a metric.Engine object and the function getAvailableMetricIds to get a list of the identifiers for the requirements-based testing metrics that you can collect. To collect results for all model testing metrics, pass the list into the execute function. For more information, see Collect Metrics on Model Testing Artifacts Programmatically.

Trace additional test results in the Model Testing Dashboard

In R2021b, you can use the Model Testing Dashboard to trace test results in a PDF report, ZIP report, or DOCX report created by Simulink Test. A test results report appears in the Test Results section of the Artifacts panel of the dashboard under the model that it traces to.
Artifacts panel showing the model db_Controller expanded to show the Test Results for the unit db_DriverSwRequest. The Test Results include a PDF report file and an MLDATX file.

To trace a report file in the Artifacts panel, you must open the dashboard for the project before generating the report.

Additionally, you can generate an MLDATX file of the test results before opening a project in the dashboard for the first time, then trace and do metric analysis on the test results.

For more information on the traceability of testing artifacts, see Explore Status and Quality of Testing Activities Using the Model Testing Dashboard.

View summary of artifacts for each unit in the model testing metrics report

In R2021b, you can view a summary of the requirements-based testing artifacts in each unit of the model testing metrics report.
An artifact summary table with columns for Artifact Group, Artifact Type, and Number of Artifacts.

After you generate a report, each unit in the report contains a table with a summary of the artifacts in that unit. The table is in the first subsection of each unit in the report. Use the summary to quickly gauge the size and structure of each unit in the report.

To generate a model testing metrics report, click Report in the Model Testing Dashboard or use the generateReport function. For an example of how to collect metrics programmatically and generate a report, see Collect Metrics on Model Testing Artifacts Programmatically.

Artifact tracing enhancements for the Model Testing Dashboard

In R2021b, the Model Testing Dashboard detects changes to the MATLAB path and updates the impacted traceability information when you open the project. The dashboard updates the following relationships:

  • From a model to another model, a library, or a data dictionary

  • From a data dictionary to another data dictionary

  • From a test to a model

The dashboard diagnostics report on the ambiguous tracing relationships caused by file shadowing and path issues. The diagnostics also show you files that you should add to the path for tracing.

Additionally, when you trace artifacts or collect results, you can now cancel these operations by clicking the Cancel button under the progress bar.

For more information on artifact tracing in the Model Testing Dashboard, see Manage Requirements-Based Testing Artifacts for Analysis in the Model Testing Dashboard.

Generate report from the Model Testing Dashboard

In R2021b, you can generate a requirements-based testing report from the toolstrip of the Model Testing Dashboard. Previously, to create a report, you needed to use the generateReport function. In the Model Testing Dashboard, collect results, then click the Report button.
Dashboard toolstrip with cursor placed over the Report button in the Results section.

In the Create Metric Result Report dialog box, specify the file format and location for the report and click Create.

Find clones anywhere within the model

From R2021b, you can find exact clones beyond the boundaries of a subsystem programmatically or by using the Clone Detector app. Prior to R2021b, you could identify subsystem clones only, that is subsystems with identical region of blocks. Matching regions of blocks that were not in the subsystem were not recognized as clones.

To enable finding clones outside subsystem boundaries, in the Clone Detector tab, click Settings, then select Detect Clones Across Model.
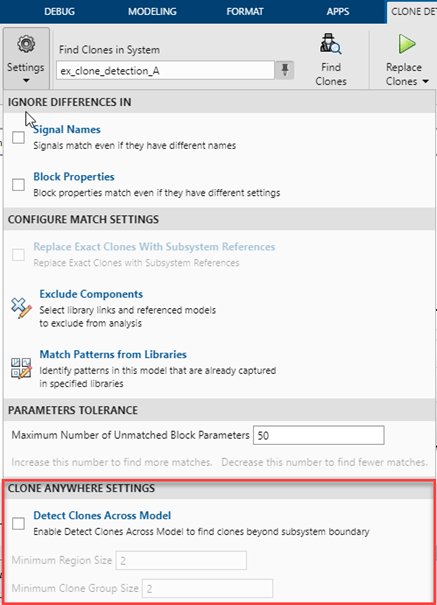
Clone detector GUI

To programmatically find clones outside subsystem boundaries, create an object of the Simulink.CloneDetection.Settings class, set the DetectClonesAcrossModel property to true, then pass this object to the Simulink.CloneDetection.findClones function to identify clones.

cloneDetectionSettings = Simulink.CloneDetection.Settings();
cloneDetectionSettings.DetectClonesAcrossModel = 1;
cloneDetectionSettings.MinimumRegionSize = 2;
cloneDetectionSettings.MinimumCloneGroupSize = 2;
cloneResults = Simulink.CloneDetection.findClones(cloneDetectionSettings);

For more information, see Find Clones Anywhere in a Model.

Programmatically detect clones in multiple models

Starting in R2021b, you can detect clones programmatically in multiple Simulink models present across different folders. Prior to R2021b, you could identify clones only in a single model hierarchy.

To identify clones across multiple models, create an object of the Simulink.CloneDetection.Settings class, add folders containing the models to the Folders property, then pass this object to the Simulink.CloneDetection.findClones function.

cloneDetectionSettings = Simulink.CloneDetection.Settings();
cloneDetectionSettings.Folders = {'Folder 1', 'Folder 2', 'Folder 3'};
cloneResults = Simulink.CloneDetection.findClones(cloneDetectionSettings);

For more information, see Detect Clones Programmatically Across Folders.

Improve Code Efficiency by Merging Multiple Interpolation Using Prelookup Blocks

In R2021b, you can use the Model Transformer tool to replace multiple Interpolation Using Prelookup blocks that have same input signals connected from the outputs of Prelookup blocks into a single Interpolation Using Prelookup block. Reducing the number of Interpolation Using Prelookup blocks in a model reduces the number of variable assignments in the code, which improves the efficiency of the generated code. You can use the Model Transformer app or programmatic commands to refactor the model.

To optimize the model in the Model Transformer, select Common source interpolation transform.
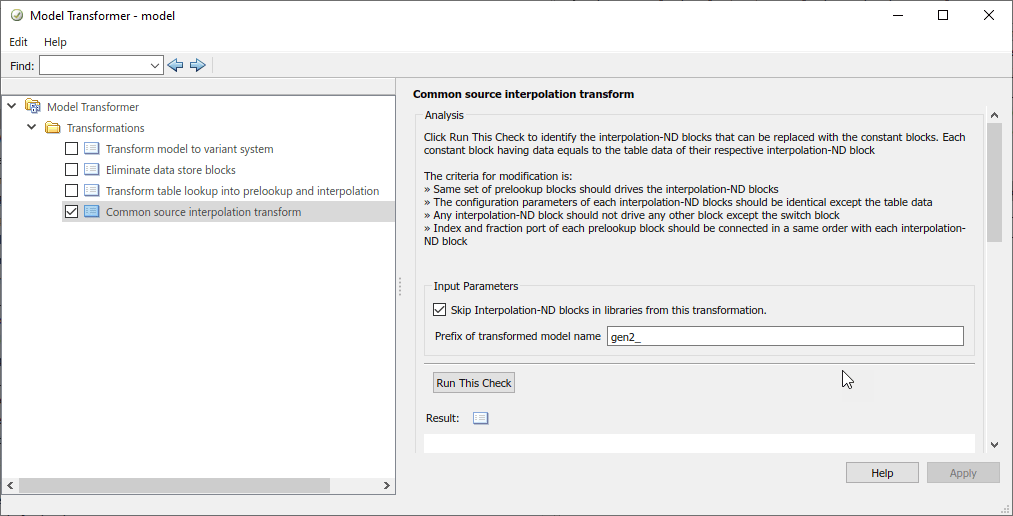
Top Model with Model reference hierarchy

To programmatically run this check, use these MATLAB commands:

SyntaxAction
Simulink.ModelTransform.CommonSourceInterpolation.identifyCandidatesIdentify eligible Interpolation Using Prelookup blocks to transform.
Simulink.ModelTransform.CommonSourceInterpolation.refactorModelReplace Interpolation Using Prelookup blocks n-D blocks.

For more information, see Improve Code Efficiency by Merging Multiple Interpolation Using Prelookup Blocks.

Improved edit-time check diagnostic interface for block constraint violations

In R2021b, the edit-time check diagnostics window now includes a Fix button you can use to address block constraint violations.
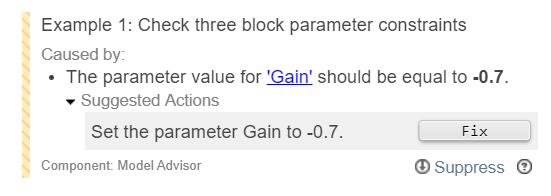
A diagnostics warning with a Fix button for addressing a block constraint violation.

To enable the edit-time checking, in the Modeling tab, select Model Advisor > Edit-Time Checks.

For more information, see Define Model Advisor Checks for Supported and Unsupported Blocks and Parameters

Simplified block constraint check authoring

You can now author block constraint checks by using a new check definition format that allows you to more easily define custom Model Advisor checks that use block constraints.

In previous releases, when authoring a block constraint check, you had to create a separate XML file with the block constraints data and then specify the properties of this XML file as part of the check definition function. In R2021b, the constraint creation is part of the block constraint check definition. Consequently, the Advisor.authoring.generateBlockConstraintsDataFile function is no longer required and the Advisor.authoring.createBlockConstraintCheck function has a 'Constraints' name-value argument that accepts a callback to a constraints creation function.

For more information, see Define Model Advisor Checks for Supported and Unsupported Blocks and Parameters.

Additional Model Slicer support for Simulink constructs

Model Slicer now supports the following:

  • Analyze the model containing array of buses.

  • Analyze the model containing Observer model elements.

  • Add Virtual elements as starting point.

Guideline Sub-ids for additional MAB/JMAAB checks ​​​​

In R2021b, these MAB/JMAAB checks are modified to have Guideline sub-ids:

 High Integrity Systems Modeling Checks: Improve quality and compliance to guidelines ​​​​

In R2021b, these high-integrity modeling checks are added:

This table identifies modeling guidelines that were modified in R2021a.

CheckRationale
Check usage of remainder and reciprocal operations
  • Updated the title.

  • The check now supports Stateflow and MATLAB domains.

Check usage of square root operations
  • Updated the title.

  • The check now supports Stateflow and MATLAB domains.

Check usage of log and log10 operations
  • Updated the title.

  • The check now supports Stateflow and MATLAB domains.

Check data types for blocks with index signalsThe check now analyzes external MATLAB files.
hisl_0019: Usage of bitwise operations

The check now supports Stateflow and MATLAB domains.

 Compatibility Considerations

This table identifies checks that are removed from the current release:

Model Advisor CheckCorresponding Modeling Guideline
Check usage of shift operations for Stateflow datahisf_0064: Shift operations for Stateflow data to improve code compliance
Check usage of equality operators in MATLAB Function blockshiml_0009: MATLAB code with equal / not equal relational operators

Observe impact of Simulink parameters using Model Slicer ​​​​

You can now use Model Slicer to analyze the impact of Simulink Parameters on the model. To find the impact of parameters on Simulink blocks, use the following functions:

FunctionExample
parametersAffectingBlock

Find Parameters Affecting a Block

[params, slicerObj] = parametersAffectingBlock(pd, 'blockA');

Input arguments:

  • pd is an object of SLSlicerAPI.ParameterDependence.

    pd = slicerObj.parameterDependence;

  • blockA is a Simulink block path/handle/SID.

Output arguments:

  • params is an array of Simulink.VariableUsage objects representing parameters affecting blockA.

  • slicerObj is an object of SLSlicerAPI.SLSlicer which has appropriate starting points added for user to highlight and validate.

blocksAffectingparameter

Find Blocks Affected By a Parameter

[affectedBlocks, slicerObj] = blocksAffectedByParameter(pd, varUsage);

Input arguments:

  • pd is an object of SLSlicerAPI.ParameterDependence.

    pd = slicerObj.parameterDependence;

  • varUsage is an object of Simulink.VariableUsage.

    varUsage = Simulink.VariableUsage('paramA','base workspace');

Output arguments:

  • affectedBlocks is an array of block handles affected downstream by varUsage .

  • slicerObj is an object of SLSlicerAPI.SLSlicer which has appropriate starting points added for user to highlight and validate.

Enhancements to edit-time checking to identify more incompatibilities ​​​​

You can now identify compatibility issues earlier in the model design process by using edit-time checking. In R2021b, when you use edit-time checking, you can view some violations of these Model Advisor checks:

Edit-time checking does not flag violations for all the constraints of these checks. It flags some specific constraint violations. By clicking the warning icon, you can see information on the constraint violation. For more information, see the check documentation and Check Model Compatibility While You Edit (Simulink Code Inspector).

 Functionality being removed or changed

ModelAdvisor.ListViewParameter class and ModelAdvisor.Check ListViewVisible property will be removed

Still runs

The ModelAdvisor.ListViewParameter class and the ListViewVisible property of the ModelAdvisor.Check class will be removed.

FunctionalityUse This Instead

When you authored a custom check, the ModelAdvisor.ListViewParameter class enabled you to populate the Model Advisor Result Explorer. Setting the ModelAdvisor.Check ListViewVisible property to true enabled the Model Advisor Result Explorer. The Model Advisor Result Explorer allowed you to locate, view, and change elements of a model.

Use hyperlinks in the Model Advisor results to view and modify model elements that are being flagged by the Model Advisor check.

For more information about using the recommended functionality, see Fix a Model to Comply with Conditions that You Specify with the Model Advisor and Create and Deploy a Model Advisor Custom Configuration.

Set Model Advisor result detail data using static method ModelAdvisor.ResultDetail.setData

Behavior change

Starting in R2021b, the setData method of the ModelAdvisor.ResultDetail class is a static method. Previously, you could call the method as an instance method on an object of the class. Now, you invoke the method using the name of the class, followed by a dot (.), then the name of the method:

ModelAdvisor.ResultDetail.setData(resultObj,args,...)

This example shows how to associate a Model Advisor check result with a specific block using the new syntax.

FunctionalityUse This Instead
block = 'vdp/Mu';
resultObj = ModelAdvisor.ResultDetail;
resultObj.setData(block);
block = 'vdp/Mu';
resultObj = ModelAdvisor.ResultDetail;
ModelAdvisor.ResultDetail.setData(resultObj, block);

For more information, see ModelAdvisor.ResultDetail.setData.