Main Content

convertToSTT

Convert Stateflow chart to state transition table

Since R2023b

Description

table = convertToSTT(chart) converts the unlocked Stateflow® chart chart to a state transition table.

example

Examples

collapse all

This example shows how to convert a Stateflow® chart to a state transition table.

Open the example model and access the Stateflow.Chart object.

open_system("sf_aircontrol")
chart = find(sfroot,"-isa","Stateflow.Chart");
view(chart)

Stateflow chart that contains top level states, PowerOn and PowerOff. PowerOn has parallel substates FAN1, FAN2, and SpeedValue. Each of FAN1 and FAN2 have exclusive substates On and Off.

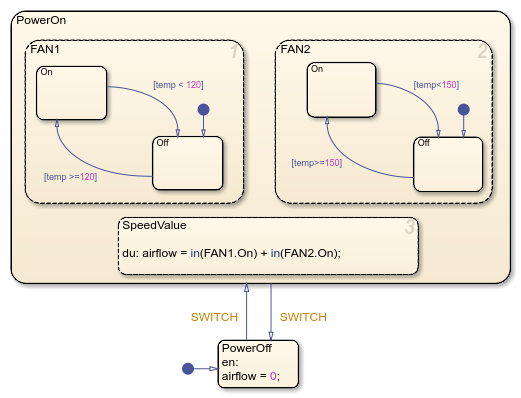
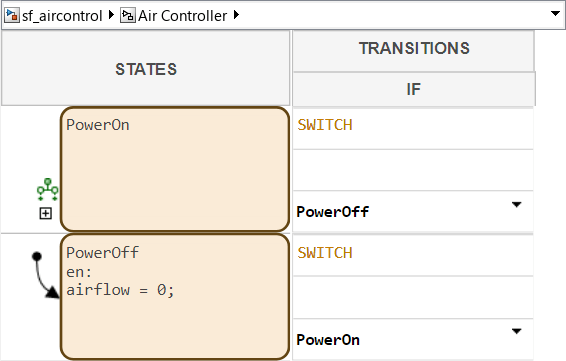
Convert the chart to a state transition table.

table = convertToSTT(chart);
view(table)

State transition table that represents the same logic as the original chart. The table displays the top level states, PowerOn and PowerOff. The hierarchy under state PowerOn is hidden by default.

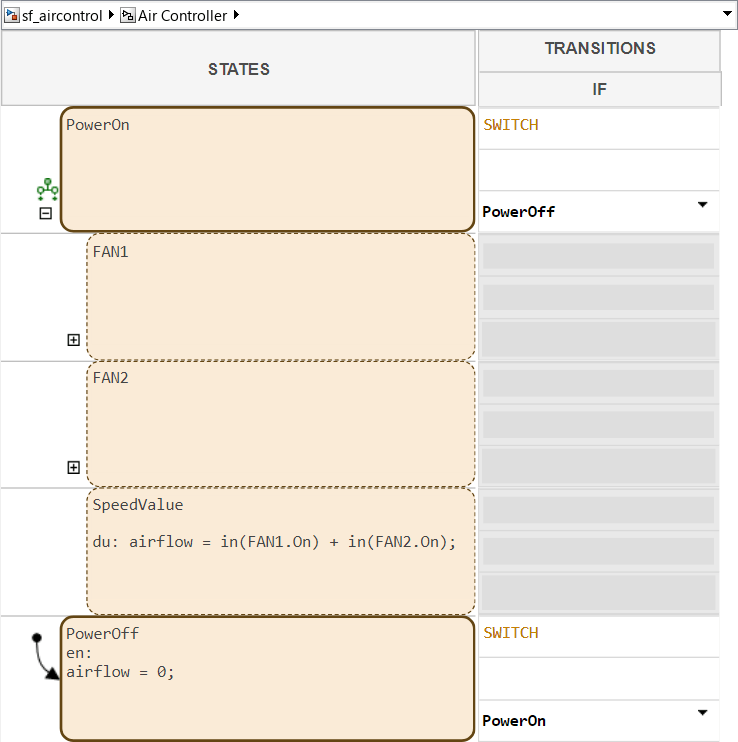
To display the child states of the state Power_On, click the button on the left of the state.

State transition table that represents the same logic as the original chart. The table displays the top level states, PowerOn and PowerOff. The hierarchy under state PowerOn is expanded, and shows parallel substates FAN1, FAN2, and SpeedValue.

Input Arguments

collapse all

Stateflow chart to convert, specified as a Stateflow.Chart object.

Limitations

  • Charts that contain super-transitions are not supported.

  • Chart must be at the top level of the Simulink® model.

  • Chart may not include variant transitions.

Version History

Introduced in R2023b