margin
Class: ClassificationLinear
Classification margins for linear classification models
Syntax
Description
m = margin(Mdl,X,Y)Mdl using predictor data in X and
corresponding class labels in Y. m
contains classification margins for each regularization strength in
Mdl.
m = margin(Mdl,Tbl,ResponseVarName)Mdl using the predictor data in table
Tbl and the class labels in
Tbl.ResponseVarName.
Input Arguments
Output Arguments
Examples
Load the NLP data set.
load nlpdataX is a sparse matrix of predictor data, and Y is a categorical vector of class labels. There are more than two classes in the data.
The models should identify whether the word counts in a web page are from the Statistics and Machine Learning Toolbox™ documentation. So, identify the labels that correspond to the Statistics and Machine Learning Toolbox™ documentation web pages.
Ystats = Y == 'stats';Train a binary, linear classification model that can identify whether the word counts in a documentation web page are from the Statistics and Machine Learning Toolbox™ documentation. Specify to hold out 30% of the observations. Optimize the objective function using SpaRSA.
rng(1); % For reproducibility
CVMdl = fitclinear(X,Ystats,'Solver','sparsa','Holdout',0.30);
CMdl = CVMdl.Trained{1};
CVMdl is a ClassificationPartitionedLinear model. It contains the property Trained, which is a 1-by-1 cell array holding a ClassificationLinear model that the software trained using the training set.
Extract the training and test data from the partition definition.
trainIdx = training(CVMdl.Partition);
testIdx = test(CVMdl.Partition);
Estimate the training- and test-sample margins.
mTrain = margin(CMdl,X(trainIdx,:),Ystats(trainIdx));
mTest = margin(CMdl,X(testIdx,:),Ystats(testIdx));
Because there is one regularization strength in CMdl, mTrain and mTest are column vectors with lengths equal to the number of training and test observations, respectively.
Plot both sets of margins using box plots.
figure;
boxplot([mTrain; mTest],[zeros(size(mTrain,1),1); ones(size(mTest,1),1)], ...
    'Labels',{'Training set','Test set'});
h = gca;
h.YLim = [-5 60];
title 'Training- and Test-Set Margins'
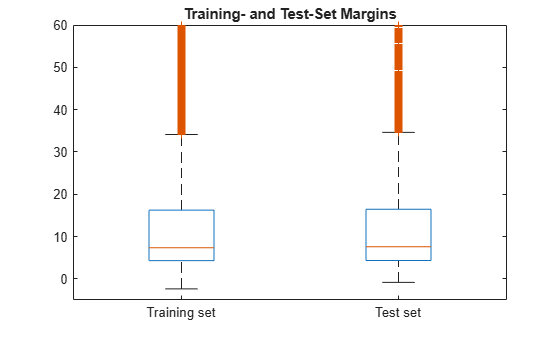
The distributions of the margins between the training and test sets appear similar.
One way to perform feature selection is to compare test-sample margins from multiple models. Based solely on this criterion, the classifier with the larger margins is the better classifier.
Load the NLP data set. Preprocess the data as in Estimate Test-Sample Margins.
load nlpdata
Ystats = Y == 'stats';
X = X';
rng(1); % For reproducibility
Create a data partition which holds out 30% of the observations for testing.
Partition = cvpartition(Ystats,'Holdout',0.30);
testIdx = test(Partition); % Test-set indices
XTest = X(:,testIdx);
YTest = Ystats(testIdx);
Partition is a cvpartition object that defines the data set partition.
Randomly choose 10% of the predictor variables.
p = size(X,1); % Number of predictors
idxPart = randsample(p,ceil(0.1*p));
Train two binary, linear classification models: one that uses the all of the predictors and one that uses the random 10%. Optimize the objective function using SpaRSA, and indicate that observations correspond to columns.
CVMdl = fitclinear(X,Ystats,'CVPartition',Partition,'Solver','sparsa',...
    'ObservationsIn','columns');
PCVMdl = fitclinear(X(idxPart,:),Ystats,'CVPartition',Partition,'Solver','sparsa',...
    'ObservationsIn','columns');
CVMdl and PCVMdl are ClassificationPartitionedLinear models.
Extract the trained ClassificationLinear models from the cross-validated models.
CMdl = CVMdl.Trained{1};
PCMdl = PCVMdl.Trained{1};
Estimate the test sample margins for each classifier. Plot the distribution of the margins sets using box plots.
fullMargins = margin(CMdl,XTest,YTest,'ObservationsIn','columns');
partMargins = margin(PCMdl,XTest(idxPart,:),YTest,...
    'ObservationsIn','columns');

figure;
boxplot([fullMargins partMargins],'Labels',...
    {'All Predictors','10% of the Predictors'});
h = gca;
h.YLim = [-20 60];
title('Test-Sample Margins')
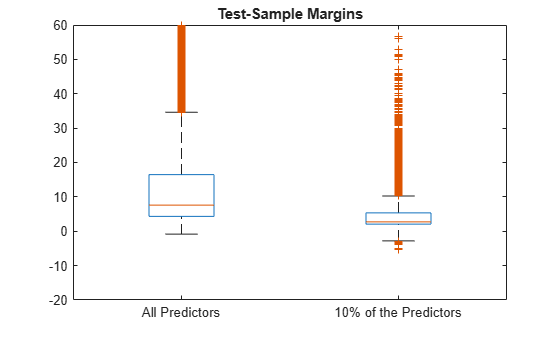
The margin distribution of CMdl is situated higher than the margin distribution of PCMdl.
To determine a good lasso-penalty strength for a linear classification model that uses a logistic regression learner, compare distributions of test-sample margins.
Load the NLP data set. Preprocess the data as in Estimate Test-Sample Margins.
load nlpdata
Ystats = Y == 'stats';
X = X';

Partition = cvpartition(Ystats,'Holdout',0.30);
testIdx = test(Partition);
XTest = X(:,testIdx);
YTest = Ystats(testIdx);
Create a set of 11 logarithmically-spaced regularization strengths from through .
Lambda = logspace(-8,1,11);
Train binary, linear classification models that use each of the regularization strengths. Optimize the objective function using SpaRSA. Lower the tolerance on the gradient of the objective function to 1e-8.
rng(10); % For reproducibility
CVMdl = fitclinear(X,Ystats,'ObservationsIn','columns',...
    'CVPartition',Partition,'Learner','logistic','Solver','sparsa',...
    'Regularization','lasso','Lambda',Lambda,'GradientTolerance',1e-8)
CVMdl =
  ClassificationPartitionedLinear
    CrossValidatedModel: 'Linear'
           ResponseName: 'Y'
        NumObservations: 31572
                  KFold: 1
              Partition: [1×1 cvpartition]
             ClassNames: [0 1]
         ScoreTransform: 'none'


  Properties, Methods
Extract the trained linear classification model.
Mdl = CVMdl.Trained{1}Mdl =
ClassificationLinear
ResponseName: 'Y'
ClassNames: [0 1]
ScoreTransform: 'logit'
Beta: [34023×11 double]
Bias: [-11.2818 -11.2818 -11.2818 -11.2818 -11.2818 -7.1383 -5.1844 -3.7740 -3.1655 -2.9610 -2.9610]
Lambda: [1.0000e-08 7.9433e-08 6.3096e-07 5.0119e-06 3.9811e-05 3.1623e-04 0.0025 0.0200 0.1585 1.2589 10]
Learner: 'logistic'
Properties, Methods
Mdl is a ClassificationLinear model object. Because Lambda is a sequence of regularization strengths, you can think of Mdl as 11 models, one for each regularization strength in Lambda.
Estimate the test-sample margins.
m = margin(Mdl,X(:,testIdx),Ystats(testIdx),'ObservationsIn','columns');
size(m)
ans = 1×2

        9471          11
Because there are 11 regularization strengths, m has 11 columns.
Plot the test-sample margins for each regularization strength. Because logistic regression scores are in [0,1], margins are in [-1,1]. Rescale the margins to help identify the regularization strength that maximizes the margins over the grid.
figure;
boxplot(10000.^m)
ylabel('Exponentiated test-sample margins')
xlabel('Lambda indices')
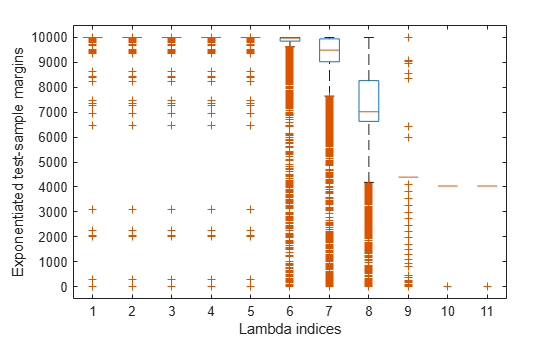
Several values of Lambda yield margin distributions that are compacted near . Higher values of lambda lead to predictor variable sparsity, which is a good quality of a classifier.
Choose the regularization strength that occurs just before the centers of the margin distributions start decreasing.
LambdaFinal = Lambda(5);
Train a linear classification model using the entire data set and specify the desired regularization strength.
MdlFinal = fitclinear(X,Ystats,'ObservationsIn','columns',...
    'Learner','logistic','Solver','sparsa','Regularization','lasso',...
    'Lambda',LambdaFinal);
To estimate labels for new observations, pass MdlFinal and the new data to predict.