Monitor Equipment State of Health Using Drift-Aware Learning
This example shows how to automate the process of monitoring the state of health for a cooling system using an incremental drift-aware learning model and Streaming Data Framework for MATLAB® Production Server™.
Machinery manufacturing facilities use cooling systems to regulate the temperature of operating equipment. Monitoring the state of these cooling systems requires significant effort from maintenance engineers. One way to reduce this effort is to automate the monitoring process by using machine learning. This example provides two apps to automate the process: uploadApp, which uploads data containing sensor readings from a cooling system; and dashboard, which you use to monitor the cooling system.
Upload Sensor Readings
You use the app uploadApp, designed using App Designer, to mimic the process of uploading sensor data to the local Kafka® server. The app uploads batches of unlabeled sensor readings along with periodic, human-annotated labeled sensor readings.
The sensors capture the following readings:
Voltage — Voltage measurement across the cooling system
Temperature — Temperature of the cooling system
Fan speed — The revolutions per minute (RPM) of the fan used in the cooling system
The cooling system has three states:
Normal
High load
Fan issue
To use the uploadApp app, you must have a Kafka server running locally at port 9092 with two topics, unlabeled and labeled. For more details on uploading data using a Kafka server, see writetimetable (MATLAB Production Server) and Streaming Data Framework for MATLAB Production Server Basics (MATLAB Production Server).
Open the uploadApp app.
uploadApp
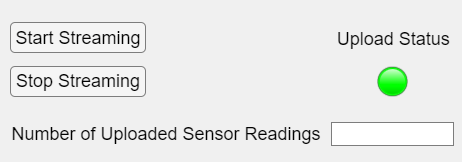
Click Start Streaming. The uploadApp app uploads 60,000 unlabeled sensor readings and 6000 labeled sensor readings, stored in the files unlabeledData.mat and labeledData.mat, respectively. Each sensor reading is sampled every 0.1 second.
The Upload Status light turns red while the app uploads the unlabeled and labeled data. When the upload is complete, the status light turns green. The Kafka server now contains data that can be accessed by anyone responsible for maintaining a cooling system.
Monitor Cooling System
You use the dashboard app, also created using App Designer, to monitor the state of health of the cooling system. The dashboard app performs the following functions:
Predict the state of health of the cooling system using the sensor readings.
Monitor the data for drift using the human-annotated labels for the sensor readings.
The dashboard app has three tabs:
Main Dashboard — Provides information on the current state of the cooling system
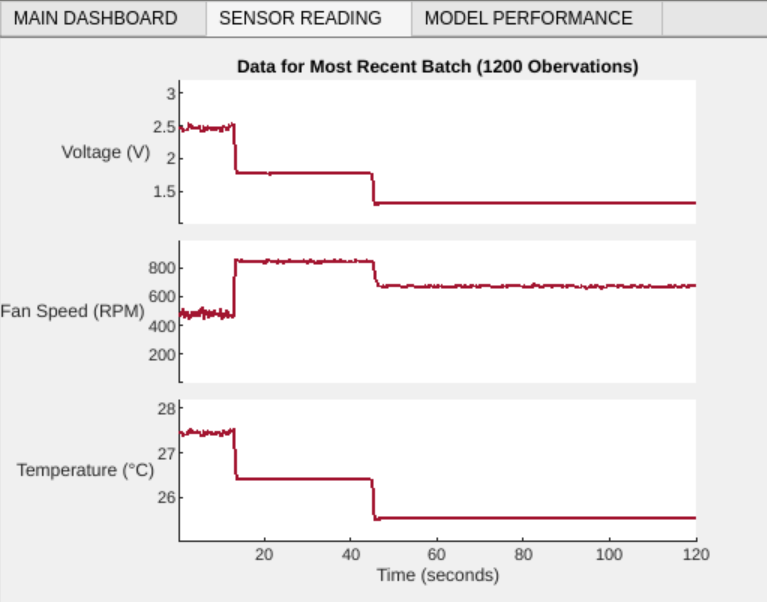
Sensor Reading — Provides information about the sensor readings from the previous two minutes
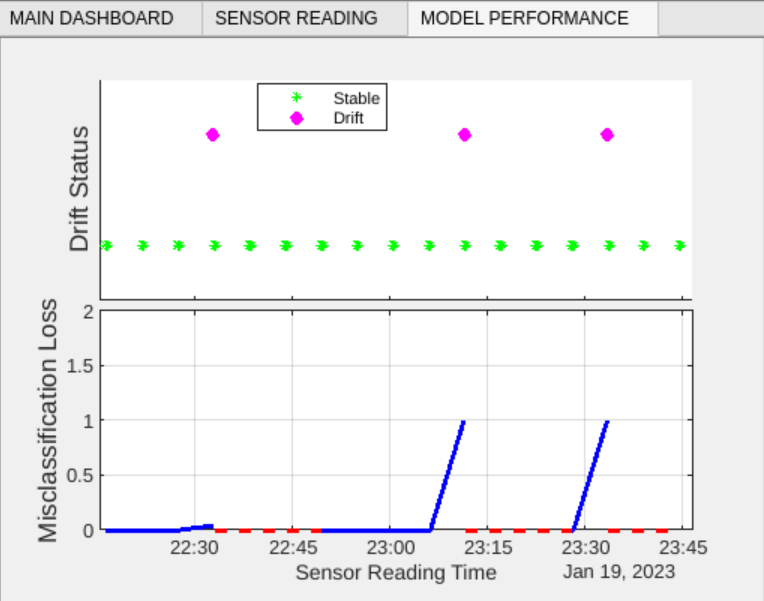
Model Performance — Contains plots that highlight how the loss and the drift status of the learner vary over time
Open the dashboard app.
dashboard
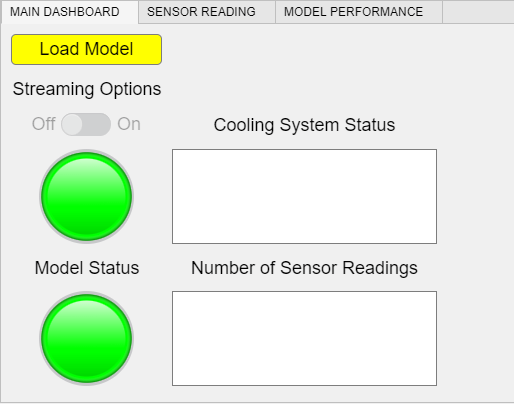
On the Main Dashboard tab, click Load Model to load the incremental drift-aware learning model (incrementalDriftAwareLearner) stored in the file warmupModel.mat. The model is a warmed-up model that uses an incremental Naive Bayes classification model as a base learner.
After the app loads the drift-aware model, the app is ready to start streaming the data uploaded to the Kafka server. You can initiate the streaming process by setting Streaming Options to On. Turning Streaming Options on the app to take the following actions:
Read 1200 observations of unlabeled data at a time from the Kafka server. Each sensor reading is sampled every 0.1 second, and 1200 observations correspond to observations for two minutes. The app uses a
kafkaStream(MATLAB Production Server) object to read the uploaded sensor readings from the Kafka server by accessing the unlabeled topic. The app also stores the readings in a timetable.Predict unlabeled sensor readings. The app predicts the state of the cooling system corresponding to the two-minute duration (1200 observations) by using the model loaded from
warmupModel.matand the sensor readings stored in the timetable.Update the cooling system status. The app computes the mode of the predicted labels (that is, the most frequently predicted label) in the two-minute duration and uses the mode to update the Cooling System Status value. The status light can be green, blue, or red to represent that the cooling system is normal, under high load, or having a fan issue, respectively. The app updates the Number of Sensor Readings value to reflect the number of unlabeled sensor readings downloaded from the server.
Update the sensor readings with the most recent values. The app plots the most recently downloaded batch (1200 observations) of sensor data on the Sensor Reading tab.
Read and check 100 observations of labeled data at a time. The app uses labeled data to monitor drift in the data distribution. If labeled data is available, the app downloads 100 observations at a time. The app uses a
kafkaStream(MATLAB Production Server) object to read the labeled sensor readings from the Kafka server by accessing the labeled topic.Check for drift and compute the misclassification loss over the 100 observations. The drift-aware model uses the 100 labeled sensor readings to determine if the data is undergoing a drift. The app computes the misclassification loss by averaging the loss values returned by the
perObservationLossfunction for the 100 observations.Update the drift status and loss plots. The app updates the plots on the Model Performance tab to show the status of the model (stable, warning, or drift) and the misclassification loss over the last batch of labeled data.
Update the model status. The Model Status turns green if the drift-aware model is warm (that is, the
IsWarmproperty of the model istrue), and the light turns red if the model is not warm (that is, theIsWarmproperty of the model isfalse). If the model detects a drift, the app overwrites the model with a new one. The model can return reliable labels after it has enough observations to become warm. For details, see the property IsWarm and the topic Incremental Drift-Aware Learning.
View the Sensor Reading tab to inspect the sensor readings of the data received in the previous two minutes.
View the Model Performance tab to monitor the drift in the data.
See Also
kafkaStream (MATLAB Production Server) | incrementalDriftAwareLearner | perObservationLoss
Topics
- Incremental Learning Overview
- Streaming Data Framework for MATLAB Production Server Basics (MATLAB Production Server)