ROC Curve and Performance Metrics
This topic describes the performance metrics for classification, including the receiver
operating characteristic (ROC) curve and the area under a ROC curve (AUC), and introduces the
Statistics and Machine Learning Toolbox™ object rocmetrics, which you can
use to compute performance metrics for binary and multiclass classification problems.
Introduction to ROC Curve
After training a classification model, such as ClassificationNaiveBayes or ClassificationEnsemble, you can examine the
performance of the algorithm on a specific test data set. A common approach is to compute a
gross measure of performance, such as quadratic loss or accuracy, averaged over the entire test
data set. You can inspect the classifier performance more closely by plotting a ROC curve and
computing performance metrics. For example, you can find the threshold that maximizes the
classification accuracy, or assess how the classifier performs in the regions of high
sensitivity and high specificity.
Receiver Operating Characteristic (ROC) Curve
A ROC curve shows the true positive rate (TPR, or sensitivity) versus the false positive rate (FPR, or 1-specificity) for different thresholds of classification scores.
Each point on a ROC curve corresponds to a pair of TPR and FPR values for a specific threshold value. You can find different pairs of TPR and FPR values by varying the threshold value, and then create a ROC curve using the pairs.
For a multiclass classification problem, you can use the one-versus-all coding design and find a ROC curve for each class. The one-versus-all coding design treats a multiclass classification problem as a set of binary classification problems, and assumes one class as positive and the rest as negative in each binary problem.
A binary classifier typically classifies an observation into a class that yields a larger score, which corresponds to a positive adjusted score for a one-versus-all binary classification problem. That is, a classifier typically uses 0 as a threshold and determines whether an observation is positive or negative. For example, if an adjusted score for an observation is 0.2, then the classifier with a threshold value of 0 assigns the observation to the positive class. You can find a pair of TPR and FPR values by applying the threshold value to all observations, and use the pair as a single point on a ROC curve. Now, assume you use a new threshold value of 0.25. Then, the classifier with a threshold value of 0.25 assigns the observation with an adjusted score of 0.2 to the negative class. By applying the new threshold to all observations, you can find a new pair of TPR and FPR values and have a new point on the a ROC curve. By repeating this process for various threshold values, you find pairs of TPR and FPR values and create a ROC curve using the pairs.
Area Under ROC Curve (AUC)
The area under a ROC curve (AUC) corresponds to the integral of a ROC curve
(TPR values) with respect to FPR from FPR = 0 to FPR = 1.
The AUC provides an aggregate performance measure across all possible thresholds. The AUC
values are in the range 0 to 1, and larger AUC values
indicate better classifier performance.
A perfect classifier always correctly assigns positive class observations to the positive class and has a true positive rate of
1for any threshold values. Therefore, the line passing through[0,0],[0,1], and[1,1]represents the perfect classifier, and the AUC value is1.A random classifier returns random score values and has the same values for the false positive rate and true positive rate for any threshold values. Therefore, the ROC curve for the random classifier lies on the diagonal line, and the AUC value is
0.5.
Performance Curve with MATLAB
You can compute a ROC curve and other performance curves by creating a rocmetrics object. The
rocmetrics object supports both binary and multiclass classification problems
and provides the following object functions:
plot— Plot ROC or other classifier performance curves.plotreturns aROCCurvegraphics object for each curve. You can modify the properties of the objects to control the appearance of each curve. For details, see ROCCurve Properties.average— Compute performance metrics for an average ROC curve for multiclass problems.addMetrics— Compute additional classification performance metrics.auc— Compute the area under the ROC curve or precision-recall curve.
You can also compute the confidence intervals of performance curves by providing cross-validated inputs or by bootstrapping the input data.
After training a classifier, use a performance curve to evaluate the classifier performance on test data. Various measures such as mean squared error, classification error, or exponential loss can summarize the predictive power of a classifier in a single number. However, a performance curve offers more information because it lets you explore the classifier performance across a range of thresholds on the classification scores.
Plot ROC Curve for Binary Classifier
Compute the performance metrics (FPR and TPR) for a binary classification problem by creating a rocmetrics object, and plot a ROC curve by using the plot function.
Load the ionosphere data set. This data set has 34 predictors (X) and 351 binary responses (Y) for radar returns, either bad ('b') or good ('g').
load ionospherePartition the data into training and test sets. Use approximately 80% of the observations to train a support vector machine (SVM) model, and 20% of the observations to test the performance of the trained model on new data. Partition the data using cvpartition.
rng("default") % For reproducibility of the partition
c = cvpartition(Y,Holdout=0.20);
trainingIndices = training(c); % Indices for the training set
testIndices = test(c); % Indices for the test set
XTrain = X(trainingIndices,:);
YTrain = Y(trainingIndices);
XTest = X(testIndices,:);
YTest = Y(testIndices);
Train an SVM classification model.
Mdl = fitcsvm(XTrain,YTrain);
Compute the classification scores for the test set.
[~,Scores] = predict(Mdl,XTest);
size(Scores)
ans = 1×2

    70     2
The output Scores is a matrix of size 70-by-2. The column order of Scores follows the class order in Mdl. Display the class order stored in Mdl.ClassNames.
Mdl.ClassNames
ans = 2×1 cell
    {'b'}
    {'g'}
Create a rocmetrics object by using the true labels in YTest and the classification scores in Scores. Specify the column order of Scores using Mdl.ClassNames.
rocObj = rocmetrics(YTest,Scores,Mdl.ClassNames);
rocObj is a rocmetrics object that stores the performance metrics for each class in the Metrics property. Compute the AUC values using the auc function.
a = auc(rocObj)
a = 1×2

    0.8587    0.8587
For a binary classification problem, the AUC values are equal to each other.
The table in Metrics contains the performance metric values for both classes, vertically concatenated according to the class order. Find the rows for the first class in the table, and display the first eight rows.
idx = strcmp(rocObj.Metrics.ClassName,Mdl.ClassNames(1));
head(rocObj.Metrics(idx,:))
    ClassName    Threshold    FalsePositiveRate    TruePositiveRate
    _________    _________    _________________    ________________

      {'b'}       15.545              0                     0
      {'b'}       15.545              0                  0.04
      {'b'}       15.105              0                  0.08
      {'b'}       11.424              0                  0.16
      {'b'}       10.077              0                   0.2
      {'b'}       9.9716              0                  0.24
      {'b'}       9.9417              0                  0.28
      {'b'}       9.0338              0                  0.32
Plot the ROC curve for each class by using the plot function.
plot(rocObj)
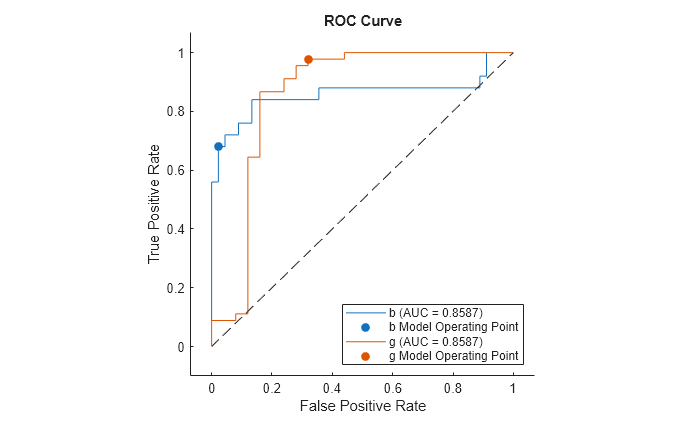
For each class, the plot function plots a ROC curve and displays a filled circle marker at the model operating point. The legend displays the class name and AUC value for each curve.
Note that you do not need to examine ROC curves for both classes in a binary classification problem. The two ROC curves are symmetric, and the AUC values are identical. A TPR of one class is a true negative rate (TNR) of the other class, and TNR is 1-FPR. Therefore, a plot of TPR versus FPR for one class is the same as a plot of 1-FPR versus 1-TPR for the other class.
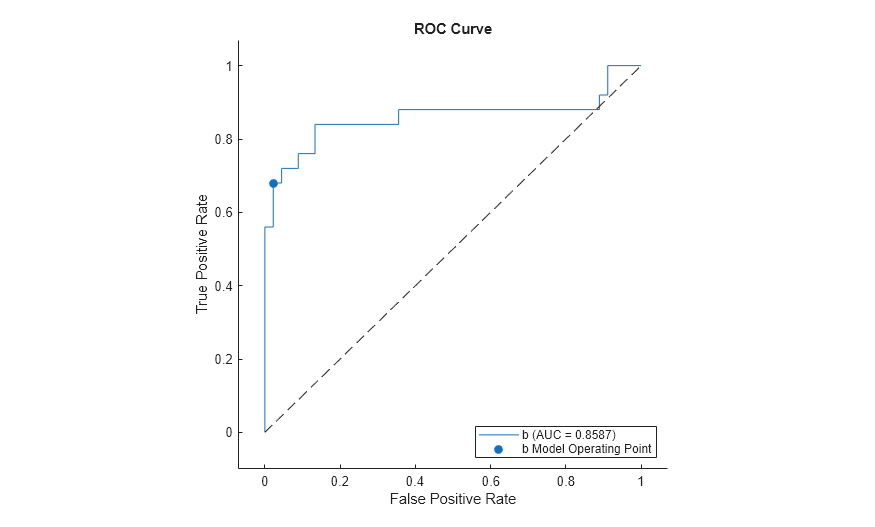
Plot the ROC curve for the first class only by specifying the ClassNames name-value argument.
plot(rocObj,ClassNames=Mdl.ClassNames(1))
Plot ROC Curves for Multiclass Classifier
Compute the performance metrics (FPR and TPR) for a multiclass classification problem by creating a rocmetrics object, and plot a ROC curve for each class by using the plot function. Specify the AverageCurveType name-value argument of plot to create the average ROC curve for the multiclass problem.
Load the fisheriris data set. The matrix meas contains flower measurements for 150 different flowers. The vector species lists the species for each flower. species contains three distinct flower names.
load fisheririsTrain a classification tree that classifies observations into one of the three labels. Cross-validate the model using 10-fold cross-validation.
rng("default") % For reproducibility
Mdl = fitctree(meas,species,Crossval="on");
Compute the classification scores for validation-fold observations.
[~,Scores] = kfoldPredict(Mdl);
size(Scores)
ans = 1×2

   150     3
The output Scores is a matrix of size 150-by-3. The column order of Scores follows the class order in Mdl. Display the class order stored in Mdl.ClassNames.
Mdl.ClassNames
ans = 3×1 cell
    {'setosa'    }
    {'versicolor'}
    {'virginica' }
Create a rocmetrics object by using the true labels in species and the classification scores in Scores. Specify the column order of Scores using Mdl.ClassNames.
rocObj = rocmetrics(species,Scores,Mdl.ClassNames);
rocObj is a rocmetrics object that stores the performance metrics for each class in the Metrics property. Compute the AUC values by using the auc function.
a = auc(rocObj)
a = 1×3

    1.0000    0.9636    0.9636
The table in Metrics contains the performance metric values for all three classes, vertically concatenated according to the class order. Find and display the rows for the second class in the table.
idx = strcmp(rocObj.Metrics.ClassName,Mdl.ClassNames(2));
rocObj.Metrics(idx,:)
ans=13×4 table
      ClassName       Threshold    FalsePositiveRate    TruePositiveRate
    ______________    _________    _________________    ________________

    {'versicolor'}           1              0                    0
    {'versicolor'}           1           0.01                  0.7
    {'versicolor'}     0.95455           0.02                  0.8
    {'versicolor'}     0.91304           0.03                  0.9
    {'versicolor'}        -0.2           0.04                  0.9
    {'versicolor'}    -0.33333           0.06                  0.9
    {'versicolor'}        -0.6           0.08                  0.9
    {'versicolor'}    -0.86957           0.12                 0.92
    {'versicolor'}    -0.91111           0.16                 0.96
    {'versicolor'}    -0.95122           0.31                 0.96
    {'versicolor'}    -0.95238           0.38                 0.98
    {'versicolor'}    -0.95349           0.44                 0.98
    {'versicolor'}          -1              1                    1
Plot the ROC curve for each class. Specify AverageCurveType="micro" to compute the performance metrics for the average ROC curve using the micro-averaging method.
plot(rocObj,AverageCurveType="micro")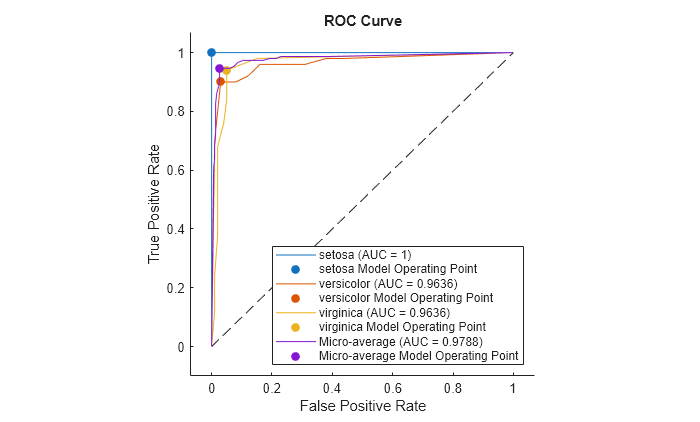
ROC Curve for Multiclass Classification
For a multiclass classifier, the rocmetrics function
computes the performance metrics of a one-versus-all ROC curve for each class, and the average function
computes the metrics for an average of the ROC curves. You can use the plot function to plot
a ROC curve for each class and the average ROC curve.
One-Versus-All (OVA) Coding Design
The one-versus-all (OVA) coding design reduces a multiclass classification
problem to a set of binary classification problems. In this coding design, each binary
classification treats one class as positive and the rest of the classes as negative.
rocmetrics uses the OVA coding design for multiclass classification and
evaluates the performance on each class by using the binary classification that the class is
positive.
For example, the OVA coding design for three classes formulates three binary classifications:
Each row corresponds to a class, and each column corresponds to a binary
classification problem. The first binary classification assumes that class 1 is a positive
class and the rest of the classes are negative. rocmetrics evaluates the
performance on the first class by using the first binary classification problem.
rocmetrics applies the OVA coding design to a binary classification
problem as well if you specify classification scores as a two-column matrix.
rocmetrics formulates two one-versus-all binary classification problems each
of which treats one class as a positive class and the other class as a negative class, and
rocmetrics finds two ROC curves. You can use one of them to evaluate the
binary classification problem.
Average of Performance Metrics
You can compute metrics for an average ROC curve by using the average function.
Alternatively, you can use the plot function to
compute the metrics and plot the average ROC curve. For examples, see Find Average ROC Curve (example for
average) and Plot Average ROC Curve for Multiclass Classifier (example for
plot).
average and plot support three algorithms for
computing the average false positive rate (FPR) and average true positive rate (TPR) to find
the average ROC curve:
Micro-averaging — The software combines all one-versus-all binary classification problems into one binary classification problem and computes the average performance metrics as follows:
Convert the values in the
Labelsproperty of arocmetricsobject to logical values where logical1(true) indicates a positive class for each binary problem.Stack the converted vectors of labels, one vector from each binary problem, into a single vector.
Convert the matrix that contains the adjusted values of the classification scores (the
Scoresproperty) into a vector by stacking the columns of the matrix.Compute the components of the confusion matrix for the combined binary problem for each threshold (each distinct value of adjusted scores). A confusion matrix contains the number of instances for true positive (TP), false negative (FN), false positive (FP), and true negative (TN).
Compute the average FPR and TPR based on the components of the confusion matrix.
Macro-averaging — The software computes the average values for FPR and TPR by averaging the values of all one-versus-all binary classification problems.
The software uses three metrics—threshold, FPR, and TPR—to compute the average values as follows:
Determine a fixed metric. If you specify
FixedMetricofrocmetricsas"FalsePositiveRate"or"TruePositiveRate", then the function holds the specified metric fixed. Otherwise, the function holds the threshold values fixed.Find all distinct values in the
Metricsproperty for the fixed metric.Find the corresponding values for the other two metrics for each binary problem.
Average the FPR and TPR values of all binary problems.
Weighted macro-averaging — The software computes the weighted average values for FPR and TPR using the macro-averaging algorithm and using the prior class probabilities (the
Priorproperty) as weights.
Performance Metrics
The rocmetrics object supports these built-in performance metrics:
Number of true positives (TP)
Number of false negatives (FN)
Number of false positives (FP)
Number of true negatives (TN)
Sum of TP and FP
Rate of positive predictions (RPP)
Rate of negative predictions (RNP)
Accuracy
True positive rate (TPR), recall, or sensitivity
False negative rate (FNR), or miss rate
False positive rate (FPR), fallout, or 1-specificity
True negative rate (TNR), or specificity
Positive predictive value (PPV), or precision
Negative predictive value (NPR)
Expected cost
rocmetrics also supports a custom metric specified as a function
handle. For details, see the AdditionalMetrics
name-value argument of the rocmetrics function.
rocmetrics computes performance metric values for various thresholds for
each one-versus-all binary classification problem using a confusion matrix, scale vector,
and misclassification cost matrix. Each performance metric is a function of a confusion matrix
and scale vector. The expected cost is also a function of the misclassification cost matrix, as
is a custom metric.
Confusion matrix — A confusion matrix contains the number of instances for true positive (TP), false negative (FN), false positive (FP), and true negative (TN).
rocmetricscomputes confusion matrices for various threshold values for each binary problem.Scale vector — A scale vector is defined by the prior class probabilities and the number of classes in true labels.
rocmetricsfinds the probabilities and number of classes for each binary problem from the prior class probabilities specified by thePriorname-value argument and the true labels specified by theLabelsinput argument.Misclassification cost matrix —
rocmetricsconverts the misclassification cost matrix specified by theCostname-value argument to the values for each binary problem.
By default, rocmetrics uses all distinct adjusted score values as threshold values for each binary problem. For more details on
threshold values, see Thresholds, Fixed Metric, and Fixed Metric Values.
Confusion Matrix
A confusion matrix is defined as
where
Pstands for "positive".Nstands for "negative".Tstands for "true".Fstands for "false".
For example, the first row of the confusion matrix defines how the classifier identifies instances of the positive class: TP is the count of correctly identified positive instances, and FN is the count of positive instances misidentified as negative.
rocmetrics computes confusion matrices for various threshold values for
each one-versus-all binary classification. The one-versus-all binary classification model
classifies an observation into a positive class if the score for the observation is greater
than or equal to the threshold value.
Prior Class Probabilities
By default, rocmetrics uses empirical probabilities, which are class
frequencies in the true labels.
rocmetrics normalizes the 1-by-K
prior probability vector π to a 1-by-2
vector for each one-versus-all binary classification, where K is the number
of classes.
The prior probabilities for the kth binary classification in which the positive class is the kth class is , where πk is the prior probability for class k in the multiclass problem.
Scale Vector
rocmetrics defines a scale vector
sk of size
2-by-1 for each one-versus-all binary classification
problem:
where P and N represent the total instances of positive class and negative class, respectively. That is, P is the sum of TP and FN, and N is the sum of FP and TN. sk(1) (first element of sk) and sk(2) (second element of sk) are the scales for the positive class (kth class) and negative class (the rest), respectively.
rocmetrics applies the scale values as multiplicative factors to the
counts from the corresponding class. That is, the function multiplies counts from the positive
class by sk(1) and counts from the negative class by sk(2). For example, to compute the positive predictive value (PPV =
TP/(TP+FP)) for the kth binary problem,
rocmetrics scales PPV as follows:
Misclassification Cost Matrix
By default, rocmetrics uses a
K-by-K cost matrix C, where C(i,j) = 1 if i ~= j, and C(i,j) = 0 if i = j. C(i,j) is the cost of classifying a point into class
j if its true class is i (that is, the rows correspond
to the true class and the columns correspond to the predicted class).
rocmetrics normalizes the K-by-K
cost matrix C to a 2-by-2 matrix for
each one-versus-all binary classification:
Ck is the cost matrix for the
kth binary classification in which the positive class is the
kth class, where costk(N|P) is
the cost of misclassifying a positive class as a negative class, and
costk(P|N) is the cost of misclassifying a negative
class as a positive class.
For class k, let
πk+ and
πk- be
K-by-1 vectors with the following values:
πki+ and πki- are the ith elements of πk+ and πk-, respectively.
The cost of classifying a positive-class (class k) observation into the negative class (the rest) is
Similarly, the cost of classifying a negative-class observation into the positive class is
Classification Scores and Thresholds
The rocmetrics function
determines threshold values from the input classification scores or the FixedMetricValues
name-value argument.
Classification Score Input for rocmetrics
rocmetrics accepts classification scores (Scores) in a matrix
of size n-by-K or a vector of length
n, where n is the number of observations and
K is the number classes. For cross-validated data,
Scores can be a cell array of vectors or a cell array of matrices.
Matrix of size n-by-K — Specify
Scoresusing the second output argument of thepredictfunction of a classification model object (such aspredictofClassificationTree). Each row of the output contains classification scores for an observation for all classes, and the column order of the output matches the class order in theClassNamesproperty of the classification model object. You can specifyScoresas a matrix for both binary classification and multiclass classification problems.If you use a matrix format,
rocmetricsadjusts the classification scores for each class relative to the scores for the rest of the classes. Specifically, the adjusted score for a class given an observation is the difference between the score for the class and the maximum value of the scores for the rest of the classes. For more details, see Adjusted Scores for Multiclass Classification Problem.Vector of length n — Specify
Scoresusing a vector when you have classification scores for one class only. A vector input is also suitable when you want to use a different type of adjusted scores for a multiclass problem. As an example, consider a problem with three classes,A,B, andC. If you want to compute a performance curve for separating classesAandB, withCignored, you need to address the ambiguity in selectingAoverB. You can use the score ratios(A)/s(B)or score differences(A)–s(B)and pass the vector torocmetrics; this approach can depend on the nature of the scores and their normalization.
You can use rocmetrics with any classifier or any function that returns a
numeric score for an instance of input data.
A high score returned by a classifier for a given instance and class signifies that the instance is likely from the respective class.
A low score signifies that the instance is not likely from the respective class.
For some classifiers, you can interpret the score as the posterior probability of observing an instance of a class given an observation. An example of such a score is the fraction of observations for a certain class in a leaf of a decision tree. In this case, scores fall into the range from 0 to 1, and scores from all classes add up to 1. Other functions can return scores ranging between minus and plus infinity, without any obvious mapping from the score to the posterior class probability.
rocmetrics does not impose any requirements on the input score range.
Because of this lack of normalization, you can use rocmetrics to process
scores returned by any classification, regression, or fit functions.
rocmetrics does not make any assumptions about the nature of input
scores.
rocmetrics is intended for use with classifiers that return scores, not
those that return only predicted classes. Consider a classifier that returns only
classification labels, 0 or 1, for data with two classes. In this case, the performance curve
reduces to a single point because the software can split classified instances into positive and
negative categories in one way only.
Adjusted Scores for Multiclass Classification Problem
For each class, rocmetrics adjusts the classification scores (input argument
Scores of rocmetrics) relative to the scores for the rest
of the classes if you specify Scores as a matrix. Specifically, the
adjusted score for a class given an observation is the difference between the score for the
class and the maximum value of the scores for the rest of the classes.
For example, if you have [s1,s2,s3] in a row of Scores for a classification problem with
three classes, the adjusted score values are [s1-max(s2,s3),s2-max(s1,s3),s3-max(s1,s2)].
rocmetrics computes the performance metrics using the adjusted score values
for each class.
For a binary classification problem, you can specify Scores as a
two-column matrix or a column vector. Using a two-column matrix is a simpler option because
the predict function of a classification object returns classification
scores as a matrix, which you can pass to rocmetrics. If you pass scores in
a two-column matrix, rocmetrics adjusts scores in the same way that it
adjusts scores for multiclass classification, and it computes performance metrics for both
classes. You can use the metric values for one of the two classes to evaluate the binary
classification problem. The metric values for a class returned by
rocmetrics when you pass a two-column matrix are equivalent to the
metric values returned by rocmetrics when you specify classification scores
for the class as a column vector.
Model Operating Point
The model operating point represents the FPR and TPR corresponding to the typical threshold value.
The typical threshold value depends on the input format of the Scores argument (classification scores) specified when you create a
rocmetrics object:
If you specify
Scoresas a matrix,rocmetricsassumes that the values inScoresare the scores for a multiclass classification problem and uses adjusted score values. A multiclass classification model classifies an observation into a class that yields the largest score, which corresponds to a nonnegative score in the adjusted scores. Therefore, the threshold value is0.If you specify
Scoresas a column vector,rocmetricsassumes that the values inScoresare posterior probabilities of the class specified inClassNames. A binary classification model classifies an observation into a class that yields a higher posterior probability, that is, a posterior probability greater than0.5. Therefore, the threshold value is0.5.
For a binary classification problem, you can specify Scores as a
two-column matrix or a column vector. However, if the classification scores are not
posterior probabilities, you must specify Scores as a matrix. A binary
classifier classifies an observation into a class that yields a larger score, which is
equivalent to a class that yields a nonnegative adjusted score. Therefore, if you specify
Scores as a matrix for a binary classifier,
rocmetrics can find a correct model operating point using the same
scheme that it applies to a multiclass classifier. If you specify classification scores that
are not posterior probabilities as a vector, rocmetrics cannot identify a
correct model operating point because it always uses 0.5 as a threshold
for the model operating point.
The plot function displays a filled circle marker at the model
operating point for each ROC curve (see ShowModelOperatingPoint). The function chooses a point corresponding to the
typical threshold value. If the curve does not have a data point for the typical threshold
value, the function finds a point that has the smallest threshold value greater than the
typical threshold. The point on the curve indicates identical performance to the performance
of the typical threshold value.
For an example, see Find Model Operating Point and Optimal Operating Point.
Thresholds, Fixed Metric, and Fixed Metric Values
rocmetrics finds the ROC curves and other metric values that correspond
to the fixed values (FixedMetricValues
name-value argument) of the fixed metric (FixedMetric
name-value argument), and stores the values in the Metrics property as a
table.
The default FixedMetric value is "Thresholds", and
the default FixedMetricValues value is "all". For each
class, rocmetrics uses all distinct adjusted score values as threshold values, computes the components of the confusion matrix for each
threshold value, and then computes performance metrics using the confusion matrix
components.
If you use the default FixedMetricValues value
("all"), specifying a nondefault FixedMetric value
does not change the software behavior unless you specify to compute confidence intervals. If
rocmetrics computes confidence intervals, then it holds
FixedMetric fixed at FixedMetricValues and computes
confidence intervals for other metrics. For more details, see Pointwise Confidence Intervals.
If you specify a nondefault value for FixedMetricValues,
rocmetrics finds the threshold values corresponding to the specified fixed
metric values (FixedMetricValues for FixedMetric) and
computes other performance metric values using the threshold values.
If you set the
UseNearestNeighborname-value argument tofalse, thenrocmetricsuses the exact threshold values corresponding to the specified fixed metric values.If you set
UseNearestNeighbortotrue, then among the adjusted scores,rocmetricsfinds a value that is the nearest to the threshold value corresponding to each specified fixed metric value.
The Metrics property includes an additional threshold value that
replicates the largest threshold value for each class so that a ROC curve starts from the
origin (0,0). The additional threshold value represents the
reject-all threshold, for which
TP = FP = 0 (no
positive instances, that is, zero true positive instances and zero false positive
instances).
Another special threshold in Metrics is the
accept-all threshold, which is the smallest threshold value for which
TN = FN = 0 (no
negative instances, that is, zero true negative instances and zero false negative
instances).
Note that the positive predictive value (PPV = TP/(TP+FP)) is
NaN for the reject-all threshold, and the negative predictive value
(NPV = TN/(TN+FN)) is NaN for the accept-all
threshold.
NaN Score Values
rocmetrics processes NaN values in the classification
score input (Scores) in one of two
ways:
If you specify
NaNFlag="omitnan"rocmetricsdiscards rows withNaNscores.If you specify
NaNFlag="includenan", thenrocmetricsadds the instances ofNaNscores to false classification counts in the respective class for each one-versus-all binary classification. That is, for any threshold, the software counts instances withNaNscores from the positive class as false negative (FN), and counts instances withNaNscores from the negative class as false positive (FP). The software computes the metrics corresponding to a threshold of1by setting the number of true positive (TP) instances to zero and setting the number of true negative (TN) instances to the total count minus theNaNcount in the negative class.
Consider an example with two rows in the positive class and two rows in the
negative class, each pair having a NaN score:
| True Class Label | Classification Score |
|---|---|
| Negative | 0.2 |
| Negative | NaN |
| Positive | 0.7 |
| Positive | NaN |
If you discard rows with NaN scores
(NaNFlag="omitnan"), then as the score threshold varies,
rocmetrics computes performance metrics as shown in the following table. For
example, a threshold of 0.5 corresponds to the middle row where rocmetrics
classifies rows 1 and 3 correctly and omits rows 2 and 4.
| Threshold | TP | FN | FP | TN |
|---|---|---|---|---|
| 1 | 0 | 1 | 0 | 1 |
| 0.5 | 1 | 0 | 0 | 1 |
| 0 | 1 | 0 | 1 | 0 |
If you add rows with NaN scores to the false category in
their respective classes (NaNFlag="includenan"), rocmetrics
computes performance metrics as shown in the following table. For example, a threshold of 0.5
corresponds to the middle row where rocmetrics counts rows 2 and 4 as
incorrectly classified. Notice that only the FN and FP
columns differ between these two tables.
| Threshold | TP | FN | FP | TN |
|---|---|---|---|---|
| 1 | 0 | 2 | 1 | 1 |
| 0.5 | 1 | 1 | 1 | 1 |
| 0 | 1 | 1 | 2 | 0 |
Pointwise Confidence Intervals
rocmetrics computes pointwise confidence intervals for the performance
metrics, including the score thresholds, by using either bootstrap samples or cross-validated
data. The object stores the values in the Metrics property.
Bootstrap — To compute confidence intervals using bootstrapping, set the
NumBootstrapsname-value argument to a positive integer.rocmetricsgeneratesNumBootstrapsbootstrap samples. The function creates each bootstrap sample by randomly selectingnout of thenrows of input data with replacement. For an example, see Compute Confidence Intervals Using Bootstrapping.Cross-validation — To compute confidence intervals using cross-validation, specify cross-validated data for true class labels (
Labels), classification scores (Scores), and observation weights (Weights) using cell arrays.rocmetricstreats elements in the cell arrays as cross-validation folds. For an example, see Compute Confidence Intervals with Cross-Validated Input Data.
You cannot specify both options. If you specify a custom metric in AdditionalMetrics, you
must use bootstrap to compute confidence intervals. rocmetrics does not support
cross-validation for a custom metric.
rocmetrics holds FixedMetric
(threshold, FPR, TPR, or a metric specified in AdditionalMetrics) fixed at
FixedMetricValues and
computes the confidence intervals on AUC and other metrics for the points corresponding to the
values in FixedMetricValues.
Threshold averaging (TA) (when
FixedMetricis"Thresholds"(default)) —rocmetricsestimates confidence intervals for performance metrics at fixed threshold values. The function takes samples at the fixed thresholds and averages the corresponding metric values.Vertical averaging (VA) (when
FixedMetricis a performance metric) —rocmetricsestimates confidence intervals for thresholds and other performance metrics at the fixed metric values. The function takes samples at the fixed metric values and averages the corresponding threshold and metric values.
The function estimates confidence intervals for the AUC value only when
FixedMetric is "Thresholds",
"FalsePositiveRate", or "TruePositiveRate".
References
See Also
rocmetrics | addMetrics | average | plot | ROCCurve Properties