Class-Based Unit Testing of Automotive Algorithms via CAN
This example shows you how to validate the output of a cruise control algorithm using the Vehicle Network Toolbox™ and MATLAB® class-based unit testing framework.
It uses the MATLAB unit test-class tCruiseControlAlgorithmVerifier.m to provide input commands via Controller Area Network (CAN) to a Simulink® model of a cruise control algorithm to trigger the functional behavior of the algorithm, and then receives feedback from the model through CAN and validates the expected behavior of the algorithm. It also generates a PDF report of the test results, which can be used for analysis. For more information on how to write the test-class, see the tCruiseControlAlgorithmVerifier.m file. The dialog in that class helps you understand the method of setting up a test-class and what each individual test does.
This example uses MathWorks® virtual CAN Channels to communicate with the algorithm.
Simulink Model Overview
The cruise control algorithm has a Virtual CAN Inputs block, which houses the setup of the CAN channel using the CAN Configuration block, and receives the message commanded from the MATLAB test-class using the CAN Receive block. It then uses the CAN Unpack block to separate the individual signals from the received CAN message, which are then converted into their appropriate data types and transmitted to the actual cruise control algorithm.
The Cruise Control Algorithm block houses the Cruise Control Algorithm State Machine, which is a Stateflow® chart. This algorithm works based on the inputs received from the Virtual CAN Inputs block and is set-up to trigger when the input conditions have reached a certain condition. The outputs of the Stateflow chart are the expected vehicle cruising speed, and algorithm engagement state.
The Virtual CAN Outputs block uses a CAN Pack block to load individual signals into a single CAN message, which are then transmitted onto the CAN bus using the CAN Transmit block. This feedback message is used for verification in the MATLAB test-class.

Create a Test Suite
Create a suite of test classes to run. In this example, the tCruiseControlAlgorithmVerifier.m is the only test in the suite. You can add additional tests in the same test suite. The 1xN Test array lists the number of tests, not the number of test-classes.
suite = testsuite("tCruiseControlAlgorithmVerifier")suite =
1×3 Test array with properties:
Name
ProcedureName
TestClass
BaseFolder
Parameterization
SharedTestFixtures
Tags
Tests Include:
0 Parameterizations, 0 Shared Test Fixture Classes, 0 Tags.
Create a Test Runner
Create a test runner to execute a set of tests in the test suite. This defines the runner with no special plugins.
runner = matlab.unittest.TestRunner.withNoPlugins
runner =
  TestRunner with properties:

    ArtifactsRootFolder: "/tmp/Bdoc26a_3233028_2210314"
       PrebuiltFixtures: [1×0 matlab.unittest.fixtures.Fixture]
Create a PDF Report Output
Set up the name of the PDF file in which you want your output to be captured.
pdfFile = "CruiseControlAlgorithmTestReport.pdf"pdfFile = "CruiseControlAlgorithmTestReport.pdf"
Add a PDF creating plugin to your test runner. Firstly, construct the plugin.
plugin = matlab.unittest.plugins.TestReportPlugin.producingPDF(pdfFile)
plugin =
  PDFTestReportPlugin with properties:

     IncludeCommandWindowText: 0
    IncludePassingDiagnostics: 0
                 LoggingLevel: Terse
                        Title: "MATLAB® Test Report"
              PageOrientation: 'portrait'
Associate this plugin with the test runner to generate the PDF report in the working directory.
runner.addPlugin(plugin)
Run Tests
Run the test suite using the test runner.
result = runner.run(suite)
Generating test report. Please wait.
    Preparing content for the test report.
    Adding content to the test report.
    Writing test report to file.
Test report has been saved to:
 /tmp/Bdoc26a_3233028_2210314/tp94d33388/vnt-ex21299704/CruiseControlAlgorithmTestReport.pdf
result =
  1×3 TestResult array with properties:

    Name
    Passed
    Failed
    Incomplete
    Duration
    Details

Totals:
   2 Passed, 1 Failed, 0 Incomplete.
   59.7849 seconds testing time.
Analyze the PDF Report
Open the PDF file created with the defined name. The default setting creates it in the current working directory. There are two things to observe in the PDF report:
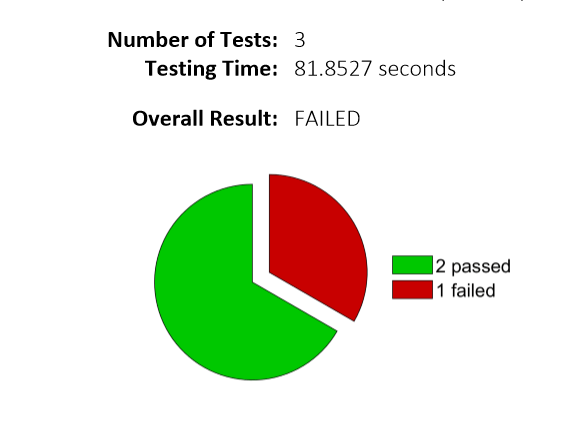
Overall Result and Result Pie Chart
The overall result states the final outcome based on whether all the tests passed or not. The pie chart shows how many tests passed and failed out of the total number of tests defined.
Failure Summary Details
The failure summary shows which test failed and for what reason.

Clicking the details tab on the right hand side of the failure name provides a detailed reason for failure, along with the diagnostic message you configured in the tests.
