How do I find the overlapping volume of multiple 3D rectangles?
Show older comments
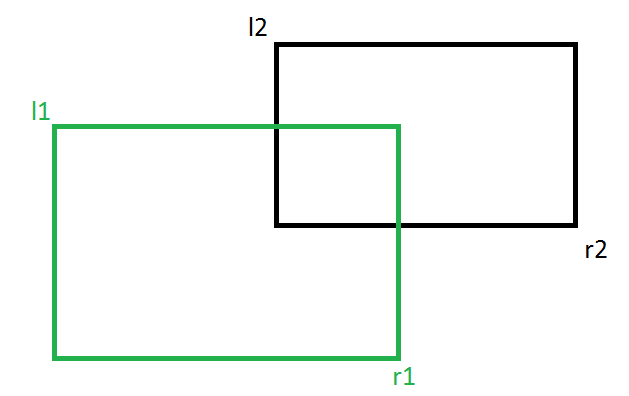
Hi! I am currently trying to calculate the overlapping region between 2 3D rectanges. I have created 2 3D rectangles (via convhulln of 8 different vertices each) and am attempting to identify and calculate the overlapping volume between these 2 rectangles (Lets say they're rectangles A and B and you could say their axes are parallel to each other; none of the rectangles are tilted with respect to each other). Imagine if the 2 rectangles below are in 3-dimensional space and that they are 3D
1) Right now, I am only able to identify if vertices from either A or B lie in the other polyhedron via the function inhull (3D version of inpolygon), which outputs a logical array, with no idea of carrying on to identify the volume of the intersected region.
2) Furthermore, I have to subtract the 'overlapping region' from lets say the green 3D rectangle, and compare this green 3D rectangle to other rectangles and carry out the same process of volume identification and volume/region 'subtraction'. What I wish to end up with is a green rectangle region that has no intersection with all the other triangles that I have compared it against, and calculate its remaining volume. I will then subtract the original volume of this green 3D rectangle (obtained from convhulln) with this 'remainder' volume, to obtain the total volume that all the overlapped regions have occupied in a sense. Would there be any efficient method to this? As I have thousands of 3D rectangles to compare against the 'template' 3D green rectangle. Thank you!!
2 Comments
darova
on 30 Apr 2020
- I have created 2 3D rectangles (via convhulln of 8 different vertices each)
But i only see 4 vertices each rectangle. Can you make a skech in 3D?
Jeng Sze Anselm Ng
on 1 May 2020
Edited: Jeng Sze Anselm Ng
on 1 May 2020

These are the 2 cuboids (T and P). - Right now I can only find if P1 and P4 lies in T using inhull, but I would need to know the volume this intersected region takes up, and remove it from cuboid T as a whole. I will then loop this process and compare many cuboids similar to cuboid P against what's left of cuboid T so as to find out what volume remains in cuboid T in the end
Accepted Answer
darova
on 1 May 2020
Try this simple script
clc,clear
% generate some data
[x1,y1,z1] = meshgrid([0 10]);
[x2,y2,z2] = meshgrid([4 15]);
y1 = y1 - 3;
% check if there is intersection
c1 = max(x1(:)) < min(x2(:)) || max(x2(:)) < min(x1(:));
c2 = max(y1(:)) < min(y2(:)) || max(y2(:)) < min(y1(:));
c3 = max(z1(:)) < min(z2(:)) || max(z2(:)) < min(z1(:));
[X,Y,Z] = deal(nan);
if c1 || c2 || c3 % if out of the limits
disp('there is no intersection')
else
X(1) = max(min(x1(:)),min(x2(:)));
X(2) = min(max(x1(:)),max(x2(:)));
Y(1) = max(min(y1(:)),min(y2(:)));
Y(2) = min(max(y1(:)),max(y2(:)));
Z(1) = max(min(z1(:)),min(z2(:)));
Z(2) = min(max(z1(:)),max(z2(:)));
end
[X,Y,Z] = meshgrid(X(1):X(2),Y(1):Y(2),Z(1):Z(2));
plot3(x1(:),y1(:),z1(:),'.b')
hold on
plot3(x2(:),y2(:),z2(:),'.r')
plot3(X(:),Y(:),Z(:),'.g')
hold off
h = legend('cube1','cube2','intersection cube');
set(h,'orientation','horizontal','location','north')
axis equal vis3d

11 Comments
Jeng Sze Anselm Ng
on 2 May 2020
Thank you for the suggestion! Works perfectly well in that I am able to get the region that intersects between the 2 cuboids!!
However, I will still need compare one of the cuboids against many others:

Take for example the 2 cuboids (black and blue), with their intersecting region being the red filled cuboid. I would still like to remove the region occupied by the red cuboid from the blue cuboid, and compare what is left of the blue cuboid to many other cuboids, and repeat the process above, and ultimately see how much volume is left in the blue cuboid at the very end. Thank you!
darova
on 2 May 2020
Correct me if im wrong: you want to take this cuboid

And compare with this red cuboid

Jeng Sze Anselm Ng
on 2 May 2020
Yep! I would then wanna remove the intersected region between the 2 cuboids.

I would then wanna compare other red cuboids (>1000+ more different cuboids) against this black one and repeat what I mentioned above.

And I will eventually be left with a black cuboid that does not intersect any of the red cuboids I have compared it against, and hopefully be able to identify the volume of that remaining black cuboid.
darova
on 2 May 2020
What about this idea?
- scale all your data between 0 .. 100
- create 3D matrix 100x100x100

A = false(100,100,100); % main cuboid
A1 = false(100,100,100); % small cuboid
A(50,50,40) = true; % center of main cuboid
A = imdilate(A,ones(35,40,40)); % put cuboid at the 'center'
for i = 1:100
A1(x(i),y(i),z(i)) = true; % center of small cuboid
A1 = imdilate(A1,ones(10,10,10))% fill small cuboid
A = A & ~A1; % substract small cuboid from main cuboid
end
Jeng Sze Anselm Ng
on 3 May 2020
darova
on 3 May 2020
- Would it be possible to explain why the center of the main cuboid is (50,50,40) and not at (50,50,50)
I just wanted to be original (better be to place the center at [50 50 50])
- and how would you know the size of the main cuboid/small cuboid [defining the structural element object array for both]?
If you have coordinates of each vertices for each cuboid you can just calculate the center
cx = mean(x);
cy = mean(y);
cz = mean(z);
- Also, does x, y and z in your example refer to the x,y, and z center coordinates of all the other cuboids, such that each 'row' in these 3 vectors represent the x,y and z coordinate of a particular cuboid based on the current loop cycle i?
Yes. Correct
Can you attach some data?
Jeng Sze Anselm Ng
on 3 May 2020
Edited: Jeng Sze Anselm Ng
on 3 May 2020


Jeng Sze Anselm Ng
on 3 May 2020
darova
on 3 May 2020
But it doesn't calculate the volume
Jeng Sze Anselm Ng
on 3 May 2020
More Answers (0)
Categories
Find more on Particle & Nuclear Physics in Help Center and File Exchange
on 30 Apr 2020
on 3 May 2020
Community Treasure Hunt
Find the treasures in MATLAB Central and discover how the community can help you!
Start Hunting!