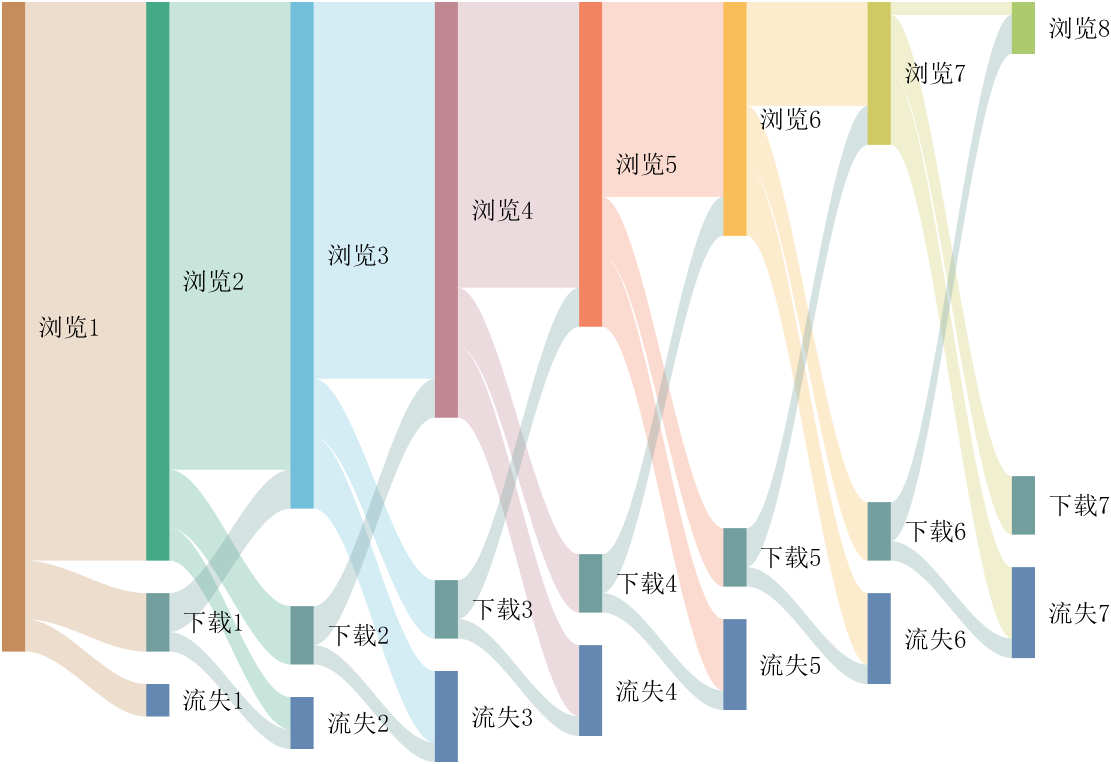
sankey plot
Sankey plot / Sankey diagram / Sankey chart / Alluvial Flow Diagram (Highly Customizable and Publication‑quality)

You are now following this Submission
- You will see updates in your followed content feed
- You may receive emails, depending on your communication preferences
Editor's Note: This file was selected as MATLAB Central Pick of the Week
Cite As
Zhaoxu Liu / slandarer (2026). sankey plot (https://www.mathworks.com/matlabcentral/fileexchange/128679-sankey-plot), MATLAB Central File Exchange. Retrieved .
General Information
- Version 8.4.2 (16.1 MB)
MATLAB Release Compatibility
- Compatible with any release
Platform Compatibility
- Windows
- macOS
- Linux
| Version | Published | Release Notes | Action |
|---|---|---|---|
| 8.4.2 | Add README.mlx |
||
| 8.4.1 | Add description. |
||
| 8.4.0 | New property 'ZeroNodeHeightRatio' and new demo. |
||
| 8.3.2 | debug |
||
| 8.3.1 | Update for biChordChart function. |
||
| 8.3.0 | Added InTotal and OutTotal properties to record total inflow and outflow values for each node. |
||
| 8.2.5 | Fixed a bug where the 'map' rendering method was unavailable when creating Sankey diagrams from adjacency matrices, and resolved the issue of link mismatches caused by adding nodes to previous layers after the diagram had been drawn. |
||
| 8.2.4 | Add nodes and links using the + operator (使用 + 运算符添加节点和链接)
|
||
| 8.2.3 | Update description and summary. |
||
| 8.2.2 | Improved description. |
||
| 8.2.1 | Increase the movable range of moveBlockX. |
||
| 8.2.0 | Added BezierRatio property to control control-point position for Bezier links |
||
| 8.1.0 | Added arrow head support with properties Arrow ('on'/'off') and ArrowHeadRatio |
||
| 8.0.0 | Added LinkType property to specify the interpolation method for link curves
|
||
| 7.1.0 | + Added 'justify' vertical alignment (新增方块竖直方向两端对齐)
|
||
| 7.0.0 | Optimized variable and graphics object name display |
||
| 6.0.8 | Update for biChordChart function. |
||
| 6.0.7 | Improved the documentation comments for biChordChart function. |
||
| 6.0.6 | Improved the documentation comments. |
||
| 6.0.5 | debug for sankeyDemo17_2 |
||
| 6.0.4 | Add new demo 17_2 |
||
| 6.0.3 | Update README.md |
||
| 6.0.2 | Create sankeyDemo0 to show equivalent code. |
||
| 6.0.1 | More detailed error messages for function `mergeAdjMat` have been added. |
||
| 6.0.0 | The globalAdj = mergeAdjMat(layerAdj) function is introduced to create global adjacency matrices. Additionally, three new examples, sankeDemo16 to sankeDemo18, are added. |
||
| 5.1.0 | # version 5.1.0
|
||
| 5.0.0 | + 左键添加数据提示框,右键隐藏高亮
|
||
| 4.0.0 | + 增添节点及链接(Add node and link)
|
||
| 3.1.1 | add demo image |
||
| 3.1.0 | % # update 3.1.0(2024-05-15)
|
||
| 3.0.0 | # update 3.0.0(2024-04-15)
|
||
| 2.0.1 | + Draw a chord-type-sankey-plot with chords flowing towards oneself 【see sankeyDemo6_2.m】 |
||
| 2.0.0 | # update 2.0.0(2024-02-04)
+ 层向右对齐(Align layers to the right)
+ 单独调整每层间隙大小(Adjust the Sep size of each layer separately)
|
||
| 1.0.0 |

