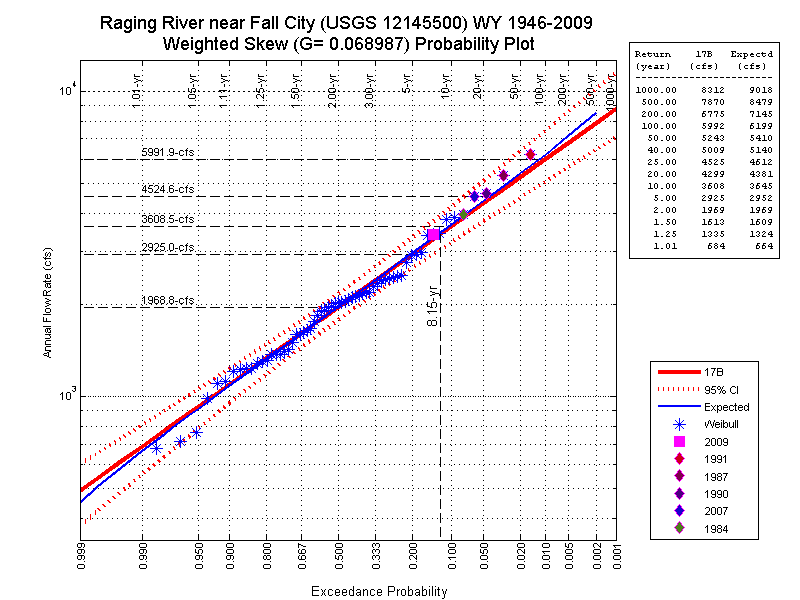
Log-Pearson Flood Flow Frequency using USGS 17B
This function will calculate flood flow frequencies using published guidelines by the USGS.

You are now following this Submission
- You will see updates in your followed content feed
- You may receive emails, depending on your communication preferences
Cite As
Jeff Burkey (2026). Log-Pearson Flood Flow Frequency using USGS 17B (https://www.mathworks.com/matlabcentral/fileexchange/22628-log-pearson-flood-flow-frequency-using-usgs-17b), MATLAB Central File Exchange. Retrieved .
General Information
- Version 1.7.0 (451 KB)
MATLAB Release Compatibility
- Compatible with any release
Platform Compatibility
- Windows
- macOS
- Linux
| Version | Published | Release Notes | Action |
|---|---|---|---|
| 1.7.0 | Modified code to no longer need lagrange.m Thanks to Shan Zou for finally solving why people were getting the lagrange error. People were downloading the wrong lagrange.m function. |
||
| 1.6.0 | Modified pplot function to create a second type of figure by displaying the legend outside the figure, and also summarizing flow frequencies in a text box. Made the comments more Report friendly. |
||
| 1.5.0 | Added a drop down reference line for projecting the last water year data point on the final frequency curve. |
||
| 1.4.0 | Given the couple of posts seeming to get errors using the example dataset, I've included the EX1.mat file for people to use instead of having people extract out the data from the example.mat file. |
||
| 1.3.0 | Updated the Figure by cleaning up the legend, also added reference lines with values displayed, and adjusted the default xticks used for the grid (i.e. pscale.mat). More detail is in the comments of the b17.m file. |
||
| 1.2.0 | Updated Graphing to include inverse of probabilities (i.e. Return Period). Also rotated X-axis tick labels (adapted code from rotateticklabel.m written by Andy Bliss). |
||
| 1.1.0 | Corrected a type-o in the title. |
||
| 1.0.0 |

