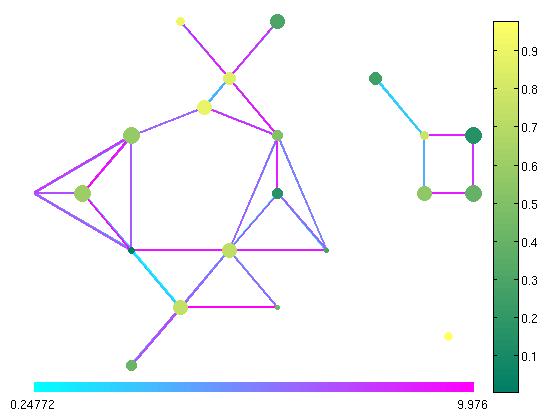
wgPlot - Weighted Graph Plot (a better version of gplot)
Plot graphs with weighted vertices and weighted edges from a weighted adjacency matrix.

You are now following this Submission
- You will see updates in your followed content feed
- You may receive emails, depending on your communication preferences
Cite As
Mike Wu (2026). wgPlot - Weighted Graph Plot (a better version of gplot) (https://www.mathworks.com/matlabcentral/fileexchange/24035-wgplot-weighted-graph-plot-a-better-version-of-gplot), MATLAB Central File Exchange. Retrieved .
General Information
- Version 1.7.0 (185 KB)
MATLAB Release Compatibility
- Compatible with any release
Platform Compatibility
- Windows
- macOS
- Linux
| Version | Published | Release Notes | Action |
|---|---|---|---|
| 1.7.0 | included a missing helper function prh.m |
||
| 1.6.0 | fix bug on plotting colored/sized markers over the default marker when user specify the vertex weight/meta data. |
||
| 1.5.0 | Fixes a minor but that plots all the vertices even when some of them are not connected to any other vertices. Now it only plots vertices that have connections by default when the adjacency matrix has lot of row/columns with no connections. |
||
| 1.4.0 | Added a missing helper file for setting the plot area for plotting the graph. Also updated wgPlot to include parameter-value pairs for specifying the marker style. |
||
| 1.3.0 | Added an missing auxiliary file for setting the axes' plot area. And updated the wgPlot to include a parameter for changing the marker style. |
||
| 1.0.0 |

