Risk Assessment Plots

Functions to calculate the NRI & IDI, difference in AUC & visualize the results

You are now following this Submission

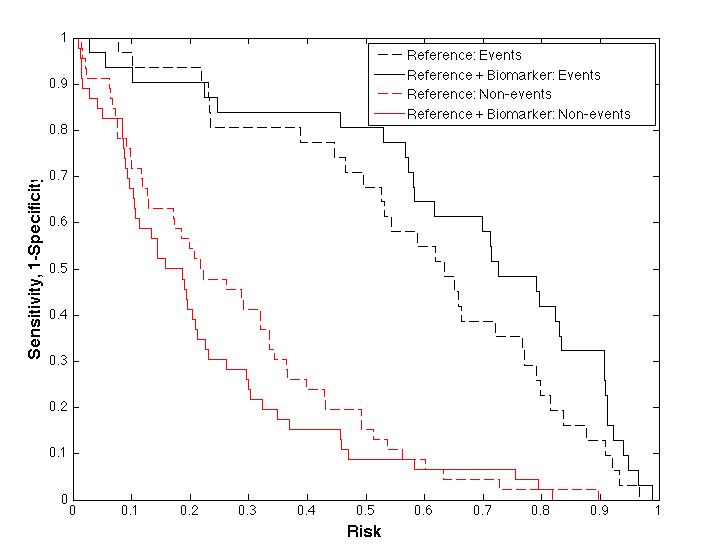
Crucial to evaluating the value of a new biomarker (variable) to a pre-existing risk model is whether it increases the calculated risk of those with the disease (event/outcome) and decreases the calculated risk of those without. In the past 4 years two new statistics - the IDI and NRI have been proposed. Risk_Assessment_Plot calculates those stats along with several others and produces a plot to visualize them. I published an explanation of this plot and the associated metrics recently - it is available Open Access: http://cjasn.asnjournals.org/content/early/2012/05/24/CJN.09590911.full
My first submission - perhaps not pretty, but useful I hope.

Cite As

John Pickering (2026). Risk Assessment Plots (https://www.mathworks.com/matlabcentral/fileexchange/37544-risk-assessment-plots), MATLAB Central File Exchange. Retrieved .

General Information

MATLAB Release Compatibility

  • Compatible with any release

Platform Compatibility

  • Windows
  • macOS
  • Linux
Version Published Release Notes Action
1.2.0.0

It has been pointed out to me that the Risk Assessment Plots look like a combination of two "classification plots" previously described by Pepe et al. I have added an appropriate reference to the description of the plot.

1.0.0.0