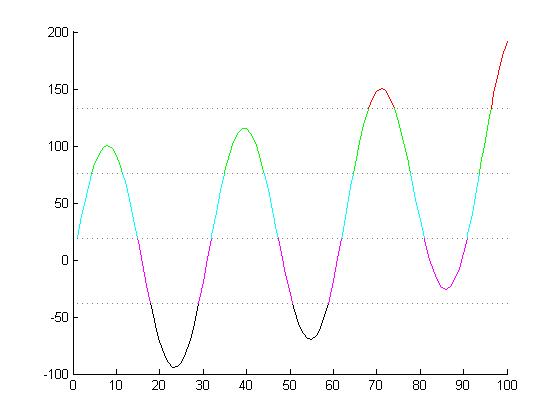
clplot( x, y, cutval, cols, varargin )
Creates a line plot whose color depends on which 'slice' of the y-range the y-value falls into.

You are now following this Submission
- You will see updates in your followed content feed
- You may receive emails, depending on your communication preferences
Cite As
Carl Witthoft (2026). clplot( x, y, cutval, cols, varargin ) (https://www.mathworks.com/matlabcentral/fileexchange/38125-clplot-x-y-cutval-cols-varargin), MATLAB Central File Exchange. Retrieved .
General Information
- Version 2.1.0 (3.13 KB)
MATLAB Release Compatibility
- Compatible with any release
Platform Compatibility
- Windows
- macOS
- Linux
| Version | Published | Release Notes | Action |
|---|---|---|---|
| 2.1.0 | Vsn 2.1: clplot now returns the cut-values and the colormap used. This allows the user to plot a second curve on the same graph by feeding these outputs into the next function call. Also minor bugfixes |
||
| 2.0.1 | Revision 2: improved input checking; fixed scaling bug that prevented large colormaps (e.g. 'jet', 'hsv' ) from properly scaling to range of y-values. |
||
| 2.0.0 | Revision 2: improved input checking; fixed scaling bug that prevented large colormaps (e.g. 'jet', 'hsv' ) from properly scaling to range of y-values. |
||
| 1.1.0 | added sample chart |
||
| 1.0.0 |

