MatStats
A Matlab Toolbox for Data Exploration and Analysis, based on a data table class.
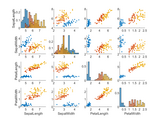
The toolbox is organized around a Table class, similar to the dataframe in R, which encapsulates data array together with row names, column names, table name. It also supports factor columns, such as categorical factors ("yes", "no"). Several utility methods are provided, and many plot functions have been override to automatically annotate the resulting plots with table meta-data when appropriate.
The toolbox also contains facilities for statistical analysis of data tables, such as principal component analysis, analysis of variance, or linear discriminant analysis. Again, intuitive methods are povided for exploring and analysing the results by taking into account the names of the rows or of the columns.
A presentation of the library is provided in the matStats-manual.pdf document.
Matlab provides a packaging mechanism via Add-On. The MatStats Add-On may be installed via the following:
- Seelct the "Add-Ons" tab from Matlab's main interface
- Choose "Get Add-Ons...". This opens the Add-On Explorer window
- Type "MatStats" in the search bar, and select the MatStats library.
- Click the "Add" button to add the library to your local configuration
To install the toolbox:
- download the zip archive of the latest release
- unzip the file
- add the 'matStats' directory to the Matlab path (see the "addpath" function from Matlab).
Some demontration scripts are provided in the "demo" directory.
The library has few (optional) dependencies:
- Some of the functions require the Statistics and machine learning toolbox from Matlab, but most of the features do not need it.
- The TableGui interface requires the GUI Layout Toolbox
- The MatGeom library is required for computing / displaying some features like inertia ellipses or ellipsoids.
The Matgeom dependency is automatically installed via the Add-On installation. Otherwise, dependencies need to be installed manually.
Cite As
David Legland (2024). MatStats (https://github.com/mattools/matStats/releases/tag/v1.1.4), GitHub. Retrieved .
MATLAB Release Compatibility
Platform Compatibility
Windows macOS LinuxCategories
Tags
Community Treasure Hunt
Find the treasures in MATLAB Central and discover how the community can help you!
Start Hunting!Discover Live Editor
Create scripts with code, output, and formatted text in a single executable document.
doc/matStats-manual/matlab/anova-iris
doc/matStats-manual/matlab/nmf
doc/matStats-manual/matlab/pca-cities
doc/matStats-manual/matlab/pca-iris
doc/matStats-manual/matlab/plots_basic
doc/matStats-manual/matlab/plots_iris
matStats
matStats/+tblui
matStats/+tblui/+actions
matStats/+tblui/+actions/+analysis
matStats/+tblui/+actions/+edit
matStats/+tblui/+actions/+file
matStats/+tblui/+actions/+plot
matStats/+tblui/+pca
matStats/@Anova
matStats/@CanDisc
matStats/@CanDisc/private
matStats/@LinearDiscriminantAnalysis
matStats/@LinearDiscriminantAnalysis/private
matStats/@Pca
matStats/@Pca/private
matStats/@Table
matStats/@Table/private
matStats/tabstats
tests
tests/anova
tests/pca
demos
demos/kmeans
demos/lda
demos/pca
| Version | Published | Release Notes | |
|---|---|---|---|
| 1.1.4 | See release notes for this release on GitHub: https://github.com/mattools/matStats/releases/tag/v1.1.4 |
|
|
| 1.1.3 | See release notes for this release on GitHub: https://github.com/mattools/matStats/releases/tag/v1.1.3 |
|
|
| 1.1.2 | See release notes for this release on GitHub: https://github.com/mattools/matStats/releases/tag/v1.1.2 |
|
|
| 1.1.1.0 | update of property names. Several new features and bug fixes. |
||
| 1.1.0.0 | add curly braces indexing, fix bugs in Table.read. |
||
| 1.0.0.0 | |||
| 0.2.0.0 | See release notes for this release on GitHub: https://github.com/mattools/matStats/releases/tag/v0.2 |
||
| 0.1.0.0 | See release notes for this release on GitHub: https://github.com/mattools/matStats/releases/tag/v0.1 |


