PLTSTMP
Version 1.0.0.0 (1.87 KB) by
Andreas
PLTSTMP adds a timestamp and name of the calling script to a graph.
Editor's Note: This file was a File Exchange Pick of the Week
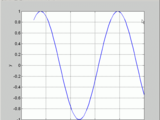
PLTSTMP adds a timestamp to the bottom of the figure. If it is called from within a function it also adds the name of the calling function.
The timestamp sometimes plots over the x-axis label. To avoid this, the axis can be shifted vertically.
Example:
>> type tst
x = [1:.1:10];
plot(x,sin(x))
pltstmp
>> tst
Cite As
Andreas (2026). PLTSTMP (https://www.mathworks.com/matlabcentral/fileexchange/4999-pltstmp), MATLAB Central File Exchange. Retrieved .
MATLAB Release Compatibility
Created with
R14
Compatible with any release
Platform Compatibility
Windows macOS LinuxCategories
Find more on Graphics Object Properties in Help Center and MATLAB Answers
Tags
Discover Live Editor
Create scripts with code, output, and formatted text in a single executable document.
| Version | Published | Release Notes | |
|---|---|---|---|
| 1.0.0.0 | In Matlab 7, DBSTACK syntax has changed so that the full path of the m-file was not shown. |

