SimCOVID 6.0
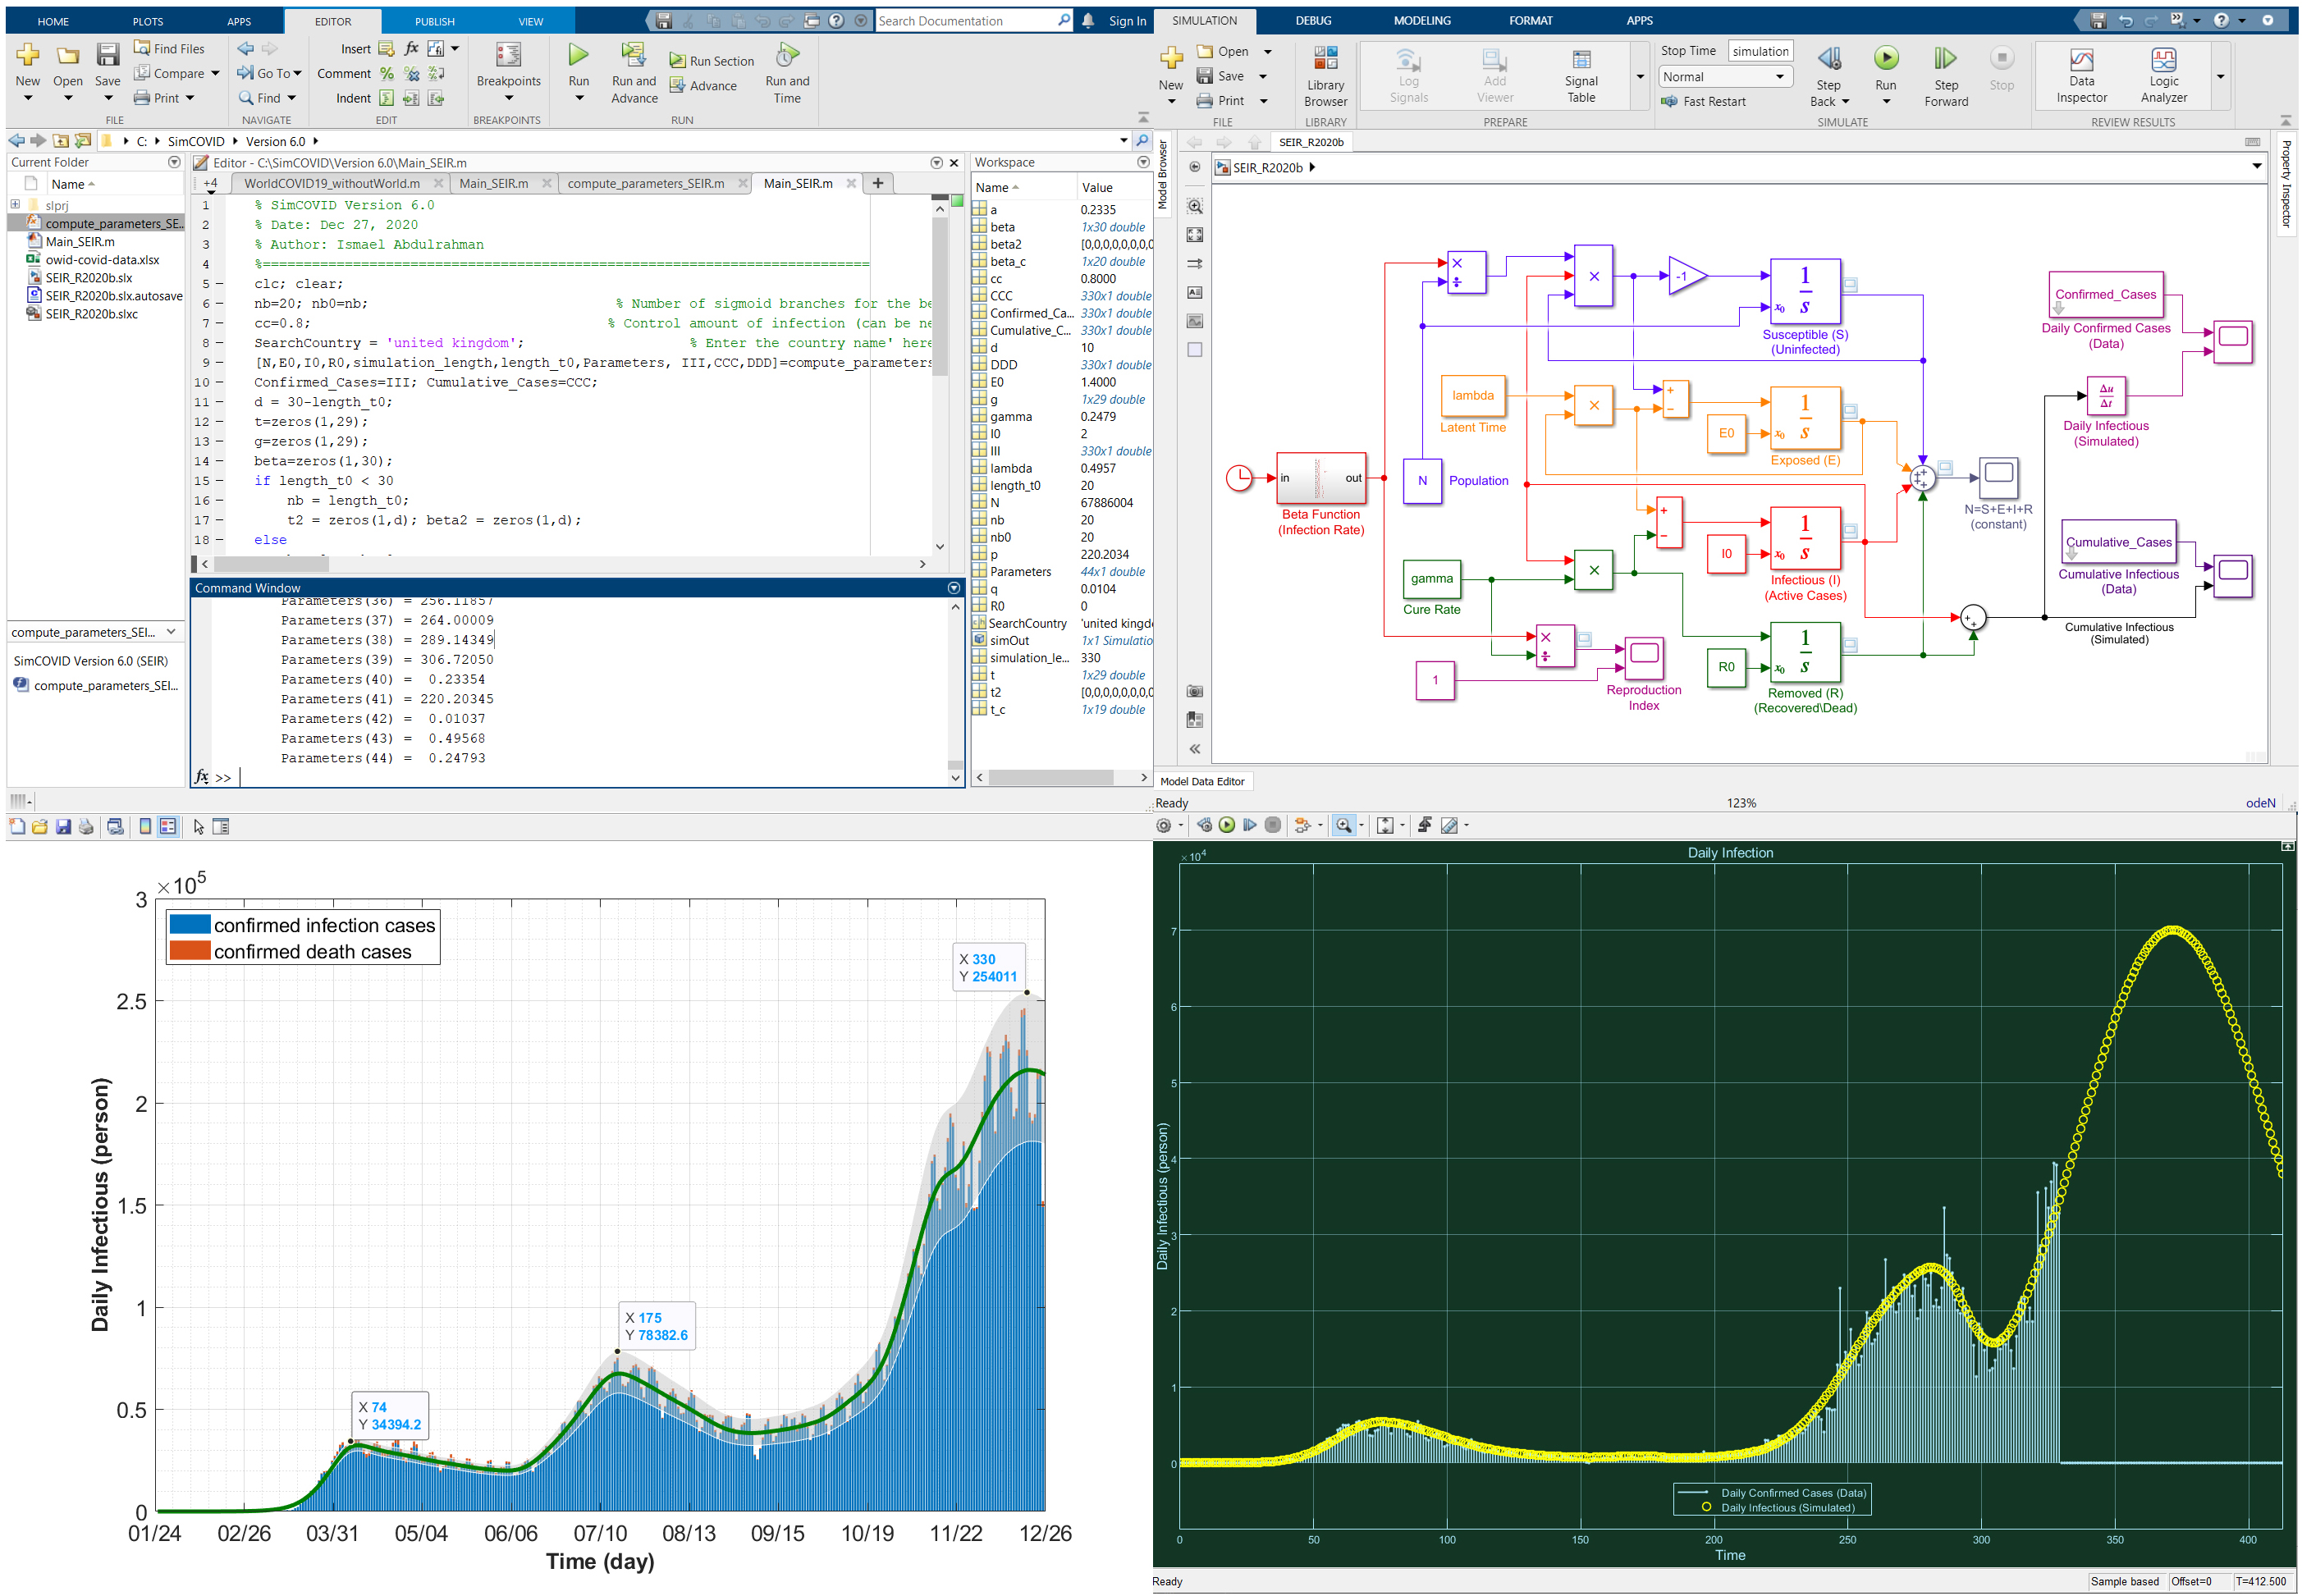
This package is used for simulating, tracking, and estimating the COVID-19 spread worldwide in a generalized, easy, and efficient way.
https://www.researchgate.net/publication/340600580_SimCOVID_An_Open-Source_Simulation_Program_for...

You are now following this Submission
- You will see updates in your followed content feed
- You may receive emails, depending on your communication preferences
Cite As
Ismael Abdulrahman (2026). SimCOVID 6.0 (https://www.mathworks.com/matlabcentral/fileexchange/75025-simcovid-6-0), MATLAB Central File Exchange. Retrieved .
General Information
- Version 6.19.0 (57.8 MB)
MATLAB Release Compatibility
- Compatible with R2018a to R2020b
Platform Compatibility
- Windows
- macOS
- Linux
| Version | Published | Release Notes | Action |
|---|---|---|---|
| 6.19.0 | Minor update. |
||
| 6.18.0 | Minor change to 6.17. |
||
| 6.17.0 | Adding extra branches for the beta function in Simulink up to 30 branches. Some other visualization improvements are included. |
||
| 6.16.0 | Modifying the codes due to adding a new source of data. |
||
| 6.15.0 | Minor change. |
||
| 6.14.0 | Minor change. |
||
| 6.13.0 | Minor change. |
||
| 6.12.0 | Minor changes. |
||
| 6.11.0 | Minor update. |
||
| 6.10.0 | Adding the 'WorldCOVID19" program to the package for plotting 2D, 3D, linear, and log color maps of the virus spread over the world for ~one year (can be edited by only updating the data). |
||
| 6.4.0 | Minor change. |
||
| 6.3.0 | Minor change. |
||
| 6.2.0 | Minor update. |
||
| 6.1.0 | Compatible with previous versions of Simulink (R2018a, R2018b, R2019a, R2019b, R2020a, R2020b) |
||
| 6.0.0 | This version of SimCOVID runs both Simulink and MATLAB models in one package.
|
||
| 5.80.0 | In this update, the new-daily confirmed data is compared to the simulated (gradient(I+R)).
|
||
| 5.75.0 | You can plot beta, gamma, and lambda results obtained from simulation. See Update 5. |
||
| 5.74.0 | Some comments. |
||
| 5.73.0 | Adding some notes. |
||
| 5.72.0 | Some improvements |
||
| 5.71.0 | Minor changes |
||
| 5.70.0 | Adding Method-5 (Update-5) in the folder (SimCOVID5\SimCOVID5\Update_5) to allow the user to choose the starting and ending date of the simulation (simulated data). |
||
| 5.62.0 | A more efficient way to choose the locations of time variables (t0). |
||
| 5.61.0 | Updating the preprint (attached). |
||
| 5.60.0 | The program in "Update 4" has now a new variable control parameter "c".
|
||
| 5.56.0 | Minor comments. |
||
| 5.55.0 | Minor updates. |
||
| 5.50.0 | Minor comments. |
||
| 5.45.0 | Adding another program with the recovery rate represented by a sigmoid function (in addition to the infection rate). |
||
| 5.40.0 | Minor updates. |
||
| 5.35.0 | Adding the cumulative plot to the update-3 program (SimCOVID5\Update_3_NEW). |
||
| 5.30.0 | Minor updates. |
||
| 5.20.0 | Adding another generalized method (Update_3_NEW) to predict the future outbreak regardless of the length of the simulation time. Change the simulation time to get the short-, medium-, and long-term estimation. |
||
| 5.10.0 | Some improvements. |
||
| 5.0.0 | NEW:
|
||
| 4.300.0 | Update:
|
||
| 4.210.0 | Minor updates. |
||
| 4.200.0 | Adding a new folder to plot both infection and death cases on the same graph. The name of the folder is "Death_and_Infectious_Combined_Plots". |
||
| 4.175.0 | Minor comments. |
||
| 4.105.0 | Minor corrections (labeling, comments...) |
||
| 4.100.0 | Adding another generalized case with multiple scenarios plots. |
||
| 4.95.0 | Minor comments. |
||
| 4.90.0 | Tracking and estimating the outbreak using the death cases (in addition to the infectious cases). |
||
| 4.85.0 | Adding a file to let plot the changes at any time "Generalized_Method3". |
||
| 4.75.0 | Adding another generalized program for estimation. |
||
| 4.5.0 | Some improvements and comments in the "generalized" program. |
||
| 4.2.0 | Minor updates. |
||
| 4.1.0 | Some minor notes. |
||
| 4.0.0 | NEW:
|
||
| 3.90.0 | Adding a detailed model of the beta function with 20 sigmoid functions to the MATLAB folder. |
||
| 3.85.0 | Adding another program to the MATLAB files with ten sigmoid steps (smoother results but relatively slower "in terms of seconds"). |
||
| 3.81.0 | Some improvements in the older versions. |
||
| 3.80.0 | Some improvements in the latest MATLAB files (faster). |
||
| 3.70.0 | Minor improvements. |
||
| 3.61.0 | Minor comments. |
||
| 3.60.0 | Minor updates. |
||
| 3.50.0 | Update 1: The initial values for the time parameters used in the sigmoid function are now selected automatically based on the given data (variables). Update 2: The sigmoid function is updated to capture some fast dynamic changes. |
||
| 3.30.0 | The sigmoid function and parameter limits are updated. |
||
| 3.20.0 | Minor comment. |
||
| 3.2.0 | Minor comments. |
||
| 3.1.0 | Update: Adding R0 (reproduction number) plot. |
||
| 3.0.0 | Now, the outbreaks in all countries around the world can be simulated in a generalized, easy, fast, and efficient way. |
||
| 2.3000.0 | Adding the case of "variable beta - variable gamma" to the MATLAB folder (program 4 in the latest "Newly-Added" folder). |
||
| 2.2000.0 | Adding a file to the MATLAB-version folder (the latest "Newly-Added" folder) to simulate the problem with considering multiple values of parameters (a percentage change in the beta function) and to plot the corresponding area. |
||
| 2.1111.0 | Adding another folder to the MATLAB version for estimating the outbreak for the rest of the simulation time (selected by the user). |
||
| 2.111.0 | Adding a folder for plotting all state variables. |
||
| 2.11.0 | Fixing the x-axis label (date). |
||
| 2.10.0 | Minor comments. |
||
| 2.1.0 | Adding some comments. |
||
| 2.0.0 | NEW:
|
||
| 1.1222.0 | The Simulink files in the folder "Newly_Added" are also saved for the use of older versions (R2019b, R2019a, R2018b, R2018a). |
||
| 1.1221.0 | The Simulink files in the folder "Newly_Added" are also saved for the use of older versions (R2018a, R2018b, R2019a, R2019b). |
||
| 1.1211.0 | Improving some detailed comments. |
||
| 1.121.0 | Three versions of initial Susceptible (S0) are used:
|
||
| 1.120.0 | Simpler models of SIR are presented here in this folder.
|
||
| 1.110.0 | Adding changes in the beta parameter at time zero using parallel loop computation. |
||
| 1.102.0 | Adding some comments |
||
| 1.101.0 | Adding a change in the beta parameter. |
||
| 1.10.0 | Minor coding comments. |
||
| 1.1.0 | A new folder is added to perform a parallel loop for the infection rate variable. This lets you automatically plot some figures like Fig. 5a-b in the paper.
|
||
| 1.0.11 | Minor code comments |
||
| 1.0.1 | 1. A new smooth step function replaced the old one to give smooth results using a sigmoid function.
|
||
| 1.0.0 |

