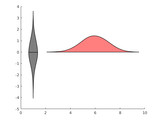
Violin Plot based on kernel density estimation, using default ksdensity
This function creates simple violin plots by estimating the kernel density, using matlabs default ksdensity(). Given a matrix or table with m columns, you will get violins for each of the columns
- 25.7K (All time)
- 87 (Last 30 days)
- 4.9 / 5
- Community
-
3 Nov 2015

Violin Plots for plotting multiple distributions (distributionPlot.m)
Function for plotting multiple histograms side-by-side in 2D - better than boxplot.
The zip-file contains the following files for visualizing distributions:- distributionPlot.m: main function that allows creating violin plots - myHistogram.m: generate histograms with 'ideal' bin
- 14.8K (All time)
- 7 (Last 30 days)
- 5.0 / 5
- Community
-
11 Feb 2017

al_goodplot - boxblot & violin plot
A data distribution visualization that notably includes boxplots and violin plots in a light and clear manner.
The visualization includes: - Raw data - Mean - Median - Standard deviation - Boxplot - Notch - Violin plot (Parzen)Ideal for group comparison, before/after change assessment...Can be typically used
- 1.7K (All time)
- 3 (Last 30 days)
- 4.7 / 5
- Community
-
17 Dec 2021
- 2.6K (All time)
- 6 (Last 30 days)
- 5.0 / 5
- Community
-
29 Feb 2024
- 3.3K (All time)
- 2 (Last 30 days)
- 4.0 / 5
- Community
-
9 Apr 2021

daviolinplot - violin and raincloud plots
Stylish and comprehensive 2-level factorial data plotting using violin plots, half-violin plots, boxplots, raincloud plots, and dotplots
. It combines boxplots, kernel density, and data scatter to produce different hybrids of violin plots, half-violin plots, raincloud plots, and dotplots. Kernel density highlights the overall shape of the
- 3K (All time)
- 33 (Last 30 days)
- 5.0 / 5
- Community
-
8 Jan 2025

Generate beautiful violin plots with professional themes.
Basic usage% X - Group positions.% Y - Matrix data.X = 1:5;Y = randn(100, 5);violinChart(gca, X, Y, 'Width',.8);legend()Categorical dataX = randi([1, 5], [1, 200]);Y = randn(1, 200) + sin(X);hdl =
- 323 (All time)
- 6 (Last 30 days)
- -- / 5
- Community
-
28 May 2026

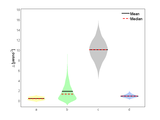
Violin Plot with mean, median and interquartile range
get violin plots from your data
% This function generates a violin plot for each dataset provided as input. % Violin plots are estimated from histcounts MATLAB function. % The thick line in the box represents the
- 45 (All time)
- 2 (Last 30 days)
- -- / 5
- Community
-
8 Nov 2024

- 488 (All time)
- 5 (Last 30 days)
- 5.0 / 5
- Community
-
23 Jul 2020

The COnstraint-Based Reconstruction and Analysis Toolbox
Creation and analysis of biochemical constraint-based models: the COBRA Toolbox v3.0
- 5K (All time)
- 28 (Last 30 days)
- 3.7 / 5
- Community
-
1 Feb 2024

- 23 (All time)
- 1 (Last 30 days)
- -- / 5
- Community
-
8 Nov 2023

Violin Plots for Matlab
Violin Plots for MatlabA violin plot is an easy to read substitute for a box plot thatreplaces the box shape with a kernel density estimate of the data, andoptionally overlays the data points itself
- 2.8K (All time)
- 73 (Last 30 days)
- -- / 5
- Community
-
23 Jul 2024

Statistical testing and plots with significance level
Basic representations of two data groups as stripcharts and violin plots. Mann-Whitney U test and t-test are performed with significance level indicators.Dot plots and violin plots are described here
- 268 (All time)
- 1 (Last 30 days)
- 5.0 / 5
- Community
-
31 Oct 2023

Multidimensional Analysis Pipeline for Histocytometry (CytoMAP) https://gitlab.com/gernerlab/cytomap
- 576 (All time)
- 4 (Last 30 days)
- -- / 5
- Community
-
22 Apr 2023

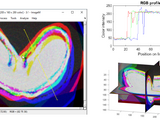
CIAtah (i.e. calciumImagingAnalysis)
CIAtah is a software package for calcium imaging analysis of one- and two-photon imaging datasets. https://github.com/bahanonu/ciatah
- 588 (All time)
- 3 (Last 30 days)
- -- / 5
- Community
-
24 Jul 2024
- 1.1K (All time)
- 1 (Last 30 days)
- 4.5 / 5
- Community
-
14 Aug 2023

This function generates a violin plot with the IQR and median value highlighted.
This function generates a violin plot with the IQR and median value highlighted.
- 21 (All time)
- 2 (Last 30 days)
- -- / 5
- Community
-
19 Jun 2023
Violin plot
Simple violin plot function using 'fitdist' and 'patch' function.Options to make 1-sided violins, rotate the violin horizontally and add a line for the median.
- 531 (All time)
- 1 (Last 30 days)
- 3.7 / 5
- Community
-
13 Aug 2019

An open-source MATLAB tool for drawing box plot and violin plot with automatic multi-way data grouping.
grpandplot: An open-source MATLAB tool for drawing box plot and violin plot with automatic multi-way data grouping.Man Ho Wong, 2022.Introductiongrpandplot features data grouping by multiple factors
- 429 (All time)
- 3 (Last 30 days)
- -- / 5
- Community
-
19 Apr 2023

violin plots for strictly positive data.
: https://fr.mathworks.com/matlabcentral/fileexchange/23661-violin-plots-for-plotting-multiple-distributions-distributionplot-m
- 60 (All time)
- 1 (Last 30 days)
- -- / 5
- Community
-
11 Dec 2018
- 68 (All time)
- 1 (Last 30 days)
- -- / 5
- Community
-
20 Dec 2018
Scatter plot with dispersion along the x-axis to reflect the point density
Scatter plot with categories on the x-axis, with width determined by data point density (like a violin plot but with the width of the violin not explicitly drawn but rather setting the x-axis
- 197 (All time)
- 2 (Last 30 days)
- 5.0 / 5
- Community
-
3 Jun 2019

Draw a box plot with various display options
Automated construction of a legend. - Set box limits as percentiles. - Set whisker extent via various methods.- Use of weighted quantiles.- Creation of violin plots.
- 10.9K (All time)
- 5 (Last 30 days)
- 4.7 / 5
- Community
-
28 Jun 2017

AbstractGeek/CategoricalScatterplot
An improved box plot that shows the data-points along with the median and the quartiles.
underlying distribution (similar to violin plots).The code is designed to be an extremely customizable alternate for the built in boxplot function in MATLAB. The syntax is very similar to that of boxplot.
- 669 (All time)
- 1 (Last 30 days)
- 5.0 / 5
- Community
-
13 Dec 2016

- Combined Sina, Violin, and Box plot with stats panel
sinaViolinBoxPlot is a versatile MATLAB function for visualizing grouped data distributions. It combines the strengths of three common plot types:Violin plots using KDE for smooth density
- 16 (All time)
- 3 (Last 30 days)
- 5.0 / 5
- Community
-
5 Dec 2025

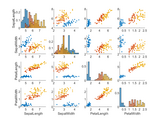
Creates (scatter, contour, regression, etc.) main plot with upper and right marginal distributions (histogram, boxplot, violin, rug, etc.).
Kernel density area + line% 5 | 'kd-hist' | Histogram overlayed with kernel density line% 6 | 'box' | Box plot (median, quartiles, outliers)% 7 | 'violin' | Full violin plot
- 247 (All time)
- 9 (Last 30 days)
- 5.0 / 5
- Community
-
13 Jun 2026

dabarplot - beautiful grouped and stacked bar plots
Bar plots for multiple conditions and groups (part of a larger toolbox for 2-level factorial data)
highlighitng data distribution properties. It combines boxplots, kernel density, and data scatter to produce different hybrids of violin plots, half-violin plots, raincloud plots, and dotplots. Kernel density
- 389 (All time)
- 5 (Last 30 days)
- 5.0 / 5
- Community
-
16 Jul 2024

Boxplots for multiple conditions and groups (part of a larger toolbox for 2-level factorial data)
highlighitng data distribution properties. It combines boxplots, kernel density, and data scatter to produce different hybrids of violin plots, half-violin plots, raincloud plots, and dotplots. Kernel density
- 1.5K (All time)
- 8 (Last 30 days)
- 4.6 / 5
- Community
-
3 Jun 2024

Levelized Cost of Energy (LCOE) Analysis
MATLAB LCOE analysis with examples for offshore wind, hydropower, and Monte Carlo simulations.
MATLAB Live Script explaining the LCOE methodology with examples.- `calculateLCOE_switch.m` – Function to compute LCOE for different energy systems.- `violin.m`, `violinplot.m` – Violin plot functions for
- 35 (All time)
- 1 (Last 30 days)
- -- / 5
- Community
-
10 Mar 2025

ggtheme for Common Plotting Functions
Apply professional theme styles to common MATLAB plotting functions (bar, line, area, box, violin). Inspired by R's ggthemr package.
- 15 (All time)
- 4 (Last 30 days)
- 5.0 / 5
- Community
-
12 May 2026

GroupDistributionPlot: Violin, Sina, Box & Histogram
Grouped violin, sina scatter, box, and histogram plots for 1–2 categorical factors.Colorblind-safe palettes. Publication-ready MATLAB output
featuresFour complementary plot elements can be shown simultaneously or in any combination:Violin plot — kernel density estimate rendered as a filled polygon, with optional symmetric, left-only, or right-only
- 12 (All time)
- 1 (Last 30 days)
- -- / 5
- Community
-
28 Apr 2026
Statistical Tools for using Generalized Linear Models (GLM)
adaptation of Bastian Bechtold's Violin plot library, available at https://github.com/bastibe/Violinplot-Matlab, for plotting and John Hartman's emmeans library, available at
- 47 (All time)
- 7 (Last 30 days)
- -- / 5
- Community
-
29 Jun 2026

This Matlab App (a installer "DrawFigure.mlappinstall"included) is designated to draw scientific figures.
- 130 (All time)
- 1 (Last 30 days)
- -- / 5
- Community
-
30 Apr 2023

gramm data visualization toolbox
gramm is a powerful and full-featured plotting and visualization toolbox similar to ggplot2 or seaborn
values (uniques or binned) with confidence intervals (stat_summary()) - histograms and density plots of x values (stat_bin() and stat_density()) - box and whisker plots (stat_boxplot()) - violin plots
- 14.7K (All time)
- 29 (Last 30 days)
- 5.0 / 5
- Community
-
8 Apr 2026
Produces sinaplots (density-scaled jittered plots)
Bar charts are bad and have polluted literature since forever. Violin plots can look weird. Strip charts, beeswarm plots, or box plots are better, but do not provide all the relevant information. To
- 77 (All time)
- 1 (Last 30 days)
- -- / 5
- Community
-
20 Nov 2018

- 1 (All time)
- 1 (Last 30 days)
- -- / 5
- Community
-
13 Jul 2026
- 12 (All time)
- 4 (Last 30 days)
- -- / 5
- Community
-
13 Jul 2026

- 184 (All time)
- 9 (Last 30 days)
- -- / 5
- Community
-
9 Jul 2026

scGEAToolbox (single-cell Gene Expression Analysis Toolbox)
Single-cell Gene Expression Analysis Toolbox
- 1.7K (All time)
- 41 (Last 30 days)
- 5.0 / 5
- Community
-
15 Jul 2026