
Anderson-Darling Goodness Of Fit Test to Inverse Gaussian Distbtn
Tests M random samples of N random vars to determine if they are from Inverse Gaussian distbtn.
This program is based on the method published by O'Reilly & Rueda (see program for more details for reference). Confidence level (i.e. alpha value) is chosen,and if the number of AD test stats
- 1.1K (All time)
- 2 (Last 30 days)
- 5.0 / 5
- Community
-
8 May 2009
Anderson-Darling k-sample procedure to test whether k sampled populations are identical.
Anderson and Darling (1952, 1954) introduced a goodness-of-fit statistic to test the hypothesis that a random sample comes from a continuous population with a specified distribution function. It is a
- 4.5K (All time)
- 3 (Last 30 days)
- 4.6 / 5
- Community
-
26 Dec 2007
Anderson-Darling test for assessing normality of a sample data.
The Anderson-Darling test (Anderson and Darling, 1952) is used to test if a sample of data comes from a specific distribution. It is a modification of the Kolmogorov-Smirnov (K-S) test and gives more
- 18K (All time)
- 2 (Last 30 days)
- 4.5 / 5
- Community
-
1 Aug 2007
Anderson-Darling test for assessing Weibull distribution of a sample data.
The Anderson-Darling test (Anderson and Darling, 1952) is used to test if a sample of data comes from a specific distribution. It is a modification of the Kolmogorov-Smirnov (K-S) test and gives more
- 2.7K (All time)
- 1 (Last 30 days)
- 4.5 / 5
- Community
-
1 Aug 2007
Modified Anderson-Darling test for Extreme Value Distribution for maxima
ModifiedADforGumbel calculates Modified Anderson-Darling test statistic and estimates p-value
ModifiedADforGumbel calculated Modified Anderson-Darling test statistic and estimates p-value for Extreme Value distribution (GEV tYpe I) for maxima. The EV parameters are eslimated by the Method of
- 112 (All time)
- 1 (Last 30 days)
- -- / 5
- Community
-
21 Feb 2016
Anderson-Darling test for assessing exponential distribution of a sample data.
The Anderson-Darling test (Anderson and Darling, 1952) is used to test if a sample of data comes from a specific distribution. It is a modification of the Kolmogorov-Smirnov (K-S) test and gives more
- 2K (All time)
- 1 (Last 30 days)
- -- / 5
- Community
-
1 Aug 2007
3 goodnes of fit tests for thw Weibull: Anderson-Darling, Chi-squared and graphic
3 goodnes of fit tests for thw Weibull: Anderson-Darling, Chi-squared and graphic
- 1.8K (All time)
- 1 (Last 30 days)
- 3.0 / 5
- Community
-
14 Aug 2008

This function calculates p-values for ten well-known normality tests.
)), Anderson-Darling (AD) test, Cramer-Von Mises (CvM) test, Shapiro-Wilk (SW) test, Shapiro-Francia (SF) test, Jarque-Bera (JB) test, D’Agostino and Pearson (DAP) test. Tests are not meant for big data. Most tests does
- 5.7K (All time)
- 8 (Last 30 days)
- 4.4 / 5
- Community
-
3 Apr 2018
Shapiro-Wilk and Shapiro-Francia normality tests.
Shapiro-Wilk & Shapiro-Francia parametric hypothesis test of composite normality.
Shapiro-Wilk parametric hypothesis test of composite normality, for sample size 3<= n <= 5000. Based on Royston R94 algorithm.This test also performs the Shapiro-Francia normality test for
- 33.5K (All time)
- 226 (Last 30 days)
- 4.9 / 5
- Community
-
18 Jun 2014
Anderson acceleration of the alternating projections method for the nearest correlation matrix.
MATLAB codes for Anderson acceleration for the alternating projectionsmethod for the nearest correlation matrix problem, based on the paperNicholas J. Higham and Nataša Strabić. Anderson
- 249 (All time)
- 3 (Last 30 days)
- 5.0 / 5
- Community
-
22 Aug 2015
SafeML: Safety Monitoring of Machine Learning Classifiers
Exploring techniques for estimating the safety of machine learning classifiers
detection of simulated network traffic, using distributional shift detection measures including the Kolmogorov-Smirnov, Kuiper, Anderson-Darling, Wasserstein and mixed Wasserstein-Anderson-Darling measures
- 148 (All time)
- 2 (Last 30 days)
- -- / 5
- Community
-
28 Jun 2021

ECDF-based Distance Measure Algorithms
A set of functions for well-known Empirical cumulative distribution function (ECDF)-based distance measures.
DistanceAnderson-Darling DistanceKolmogorov Smirnov DistanceCramer von Mises DistanceKuiper DistanceWasserstein-Anderson-Darling DistanceRelated WorksThe code has been converted to MATLAB from "twosamples" library of R
- 327 (All time)
- 1 (Last 30 days)
- -- / 5
- Community
-
28 Jun 2021

Live Script exploring tests of an empirical distribution for normality.
Anderson-Darling test and a Kolmogorov-Smirnov test for normality.This script may interest students and educators in physics and other STEM fields. Sliders are provided to adjust the empirical distribution
- 17 (All time)
- 2 (Last 30 days)
- -- / 5
- Community
-
9 Feb 2026

AI Verification Library for Deep Learning Toolbox
Verify and test robustness of deep learning networks, deploy with confidence
AI Verification Library for Deep Learning Toolbox allows you to verify and test properties of deep learning networks, and deploy these models with confidence.Use this library to:Verify network
- 4.4K (All time)
- 273 (Last 30 days)
- 5.0 / 5
- MathWorks
-
11 May 2026
Calculate the Student t Test for unequal or equal samples size, unpaired or paired samples.
Student's t test for unpaired or paired samples.This file is applicable for equal or unequal sample sizes; for paired or unpaired samples. When the test is unpaired, the Fisher-Snedecor F-test
- 9.6K (All time)
- 1 (Last 30 days)
- 5.0 / 5
- Community
-
21 Nov 2025

INPOLY: A fast points-in-polygon test
A fast test to determine point inclusion for general polygonal geometries.
examplepolydemo(2); % multiply-connected domainspolydemo(3); % speed comparisonINPOLY implements a sorted 'crossing-number' test designed to achieve fast performance for complex inputs. Given a configuration with N
- 13.8K (All time)
- 6 (Last 30 days)
- 4.6 / 5
- Community
-
19 Dec 2020
Cramer-von Mises goodness-of-fit test for simple Null Hypothesis
Estimates p-value of acceptance of a simple H0: "CDF with parameters estimated of given sample"
puts the same weight on an entire range of X (unlike the Anderson-Darling test putting more weight on tails of a distribution).
- 105 (All time)
- 1 (Last 30 days)
- -- / 5
- Community
-
14 Aug 2017

MATLAB function to create a zone plate test image
and also for testing the anti-aliasing capability of image resizing methods.For more
- 1.5K (All time)
- 1 (Last 30 days)
- 5.0 / 5
- Community
-
3 Dec 2019

Testing Safety Critical Control Systems
This is a presentation on testing of safety critical control systems.
This has a presentation on testing Safety Critical Control Systems and a brief introduction to Formal Methods
- 2.2K (All time)
- 4 (Last 30 days)
- 5.0 / 5
- Community
-
12 Aug 2017
Jonckheere-Terpstra test on trend
A nonparametric Test for Trend
Perform the Jonckheere-Terpstra test on trend.There are situations in which treatments are ordered in some way, for example the increasing dosages of a drug. In these cases a test with the more
- 2.9K (All time)
- 3 (Last 30 days)
- 5.0 / 5
- Community
-
3 Dec 2025

Communications Toolbox Support Package for Analog Devices ADALM-Pluto Radio
Prototype and test software-defined radio (SDR) systems using ADALM-PLUTO with MATLAB and Simulink
use ADALM-Pluto Radio as a standalone peripheral for live RF data I/O using MATLAB functions or Simulink blocks. This lets you quickly test your transmitter and receiver designs under real-world
- 23.3K (All time)
- 262 (Last 30 days)
- 3.0 / 5
- MathWorks
-
26 Jan 2026
Benjamini & Hochberg/Yekutieli false discovery rate control procedure for a set of statistical tests
Executes the Benjamini & Hochberg (1995) procedure for controlling the false discovery rate (FDR) of a family of hypothesis tests. FDR is the expected proportion of rejected hypotheses that are
- 13.8K (All time)
- 78 (Last 30 days)
- 4.9 / 5
- Community
-
19 Dec 2015
A Wilcoxon-Type Test for Trend
Perform the Cuzick's test on trend.This function provides a Wilcoxon-type test for trend across a group of three or more independent random samples. Assumptions: Data must be at least ordinal
- 2.5K (All time)
- 2 (Last 30 days)
- 5.0 / 5
- Community
-
3 Dec 2025

This function automatically validates the normality of your data using 9 appropriate statistical and visualization techniques.
your data against renowned statistical tests including Shapiro-Wilk, Kolmogorov-Smirnov, Anderson-Darling, Jarque-Bera, and Lilliefors tests. The function compiles resulting P-values in a concise table
- 155 (All time)
- 3 (Last 30 days)
- -- / 5
- Community
-
21 Feb 2024
Test whether addition of model parameters is warranted by improvement of data misfits.
This function uses an F-test to determine the likelihood that an observed improvement of a fit to data warrants the use of additional parameters.Usage:>> [ p, Fstat, df1, df2 ] =
- 892 (All time)
- 3 (Last 30 days)
- 5.0 / 5
- Community
-
16 May 2013

Automated Driving Toolbox Test Suite for Euro NCAP Protocols
Automatically generate seed scenarios for the Euro NCAP test protocols and generate scenario variants.
The Automated Driving Toolbox™ Test Suite for Euro NCAP® Protocols support package enables you to automatically generate specifications for various Euro NCAP® tests, which include safety assessments
- 346 (All time)
- 10 (Last 30 days)
- 4.0 / 5
- MathWorks
-
11 May 2026

Sinusoidal Signal Significance Explorer
Live Script illustrating hypothesis tests with a noisy sinusoidal signal.
This Live Script illustrates various hypothesis tests (Lillifors, Jarque-Bera, Anderson-Darling, Kolmogorov–Smirnov, Wald–Wolfowitz runs test, autocorrelation Ljung-Box Q-test, and Fisher
- 8 (All time)
- 2 (Last 30 days)
- -- / 5
- Community
-
9 Feb 2026

NI USRP Radio Support from Wireless Testbench
Test wideband wireless systems and perform spectrum monitoring
spectrum monitoring and the testing of wideband wireless systems. Additionally, high-rate signal capture enables data set creation for the training of deep-learning models for wireless applications.You can
- 1.4K (All time)
- 25 (Last 30 days)
- 1.0 / 5
- MathWorks
-
11 May 2026
Perform the McNemar test on a 2x2 matrix
Permorm McNemar's chi square on a 2x2 matrixIn statistics, McNemar's test is a non-parametric method used on nominaldata to determine whether the row and column marginal frequencies areequal. It is
- 3.9K (All time)
- 3 (Last 30 days)
- 4.0 / 5
- Community
-
19 Nov 2025

NPCR and UACI measurements with statistical tests
Randomness measure of 'number of pixel changing rate' and 'unified average changed intensity'
This single m file implements the randomness measure of NPCR and UACI, and produces the classic quantitative scores and the new qualitative randomness test p-Vals.
- 1.7K (All time)
- 2 (Last 30 days)
- 5.0 / 5
- Community
-
24 Sep 2013

Simulink Test Support Package for ASAM XIL Standard
This support package adds ASAM XIL Standard support to the Test Manager in Simulink Test.
The Simulink® Test™ Support Package for ASAM® XIL Standard implements the ASAM XIL API, which is a standard that defines communication between test automation tools, such as Simulink Test, and test
- 73 (All time)
- 1 (Last 30 days)
- -- / 5
- MathWorks
-
26 Jan 2026

A permutation test (aka randomization test) for MATLAB, testing for a difference in means between two samples.
A permutation test (aka randomization test) for MATLAB, testing for a difference in means between two samples. It supports one- and two-tailed tests, and returns a p-value, the observed difference
- 3.8K (All time)
- 10 (Last 30 days)
- 4.9 / 5
- Community
-
19 Feb 2024
Test two key cognitive skills, response inhibition and selective attention
Because most people’s automatic response is to read a word, the Stroop Test is a classic test of response inhibition. This skill involves responding quickly while avoiding incorrect impulses that may
- 2.2K (All time)
- 4 (Last 30 days)
- 4.5 / 5
- Community
-
13 May 2014
Mann-Whitney-Wilcoxon non parametric test for two unpaired groups.
This file execute the non parametric Mann-Whitney-Wilcoxon test to evaluate thedifference between unpaired samples. If the number of combinations is less than20000, the algorithm calculates the exact
- 8.2K (All time)
- 4 (Last 30 days)
- 5.0 / 5
- Community
-
26 Nov 2025
Implements the Gottwald - Melbourne 0 - 1 test for chaos
In 2004 Georg Gottwald and Ian Melbourne introduced a new test for chaos (Proc. Roy. Soc. A 460, 603–611). The input is any time series, that may come from a discrete map, a differential equation or
- 3K (All time)
- 8 (Last 30 days)
- 4.8 / 5
- Community
-
17 Aug 2009

The test calculate the performance of a clinical test based on the Bayes theorem
) - Test Accuracy - Mis-classification Rate - F-Measure - Test bias - Error odds ratio - Diagnostic odds ratio - Discriminant Power Example: x=[731 270;78 1500
- 16K (All time)
- 1 (Last 30 days)
- 4.8 / 5
- Community
-
26 Nov 2025
Perform permutation test to estimate P-value for one-way ANOVA
Follows Anderson (doi:10.1139/cjfas-58-3-626) to estimate P-values for one-way ANOVA using permutation of data over grouping variable.
- 389 (All time)
- 2 (Last 30 days)
- 5.0 / 5
- Community
-
14 Nov 2013

- 1.2K (All time)
- 4 (Last 30 days)
- 3.0 / 5
- Community
-
24 Mar 2016
Seasonal Kendall Test with Slope for Serial Dependent Data
Seasonal trends using tau-a,b and seasonal slope with intervals, accounts for serial dependence.
Seasonal Kendall Trend Test for Data with and without Searial Dependance.Tau-b seasonal: takes into account ties (and multiple observations, except, the data are preprocessed in a subfucntion and
- 4.9K (All time)
- 1 (Last 30 days)
- 5.0 / 5
- Community
-
21 Feb 2012
Dunn's procedure for multiple, non parametric, comparisons
Dunn's test is the not parametric analog of Holm-Sidak multiple t-test. When you use the Kruskal-Wallis test, you know if there is a difference among your groups, but you can't apply the KWtest for
- 5.5K (All time)
- 5 (Last 30 days)
- 4.5 / 5
- Community
-
3 Dec 2025
- 14 (All time)
- 1 (Last 30 days)
- 5.0 / 5
- Community
-
15 Sep 2021

Tire test data is processed and Magic Formula coefficients are calculated.
TireDataAnalysis.mlx processes tire test data from acceleration and brake as well as cornering tests and returns the Pacejka’s Magic Formula coefficients for both a longitudinal and lateral model.
- 3.8K (All time)
- 7 (Last 30 days)
- 4.3 / 5
- Community
-
3 Apr 2024

Design and Test Lithium Ion Battery Management Algorithms
This example project can be used as a reference design to get started with designing Battery Management System with MATLAB and Simulink.
Management - Over/Under Voltage, Over Current, Over Temperature etc. 5. Charge and Discharge Current Limit Calculations To design and test these algorithms, project also includes files for 1. Li-ion Battery
- 26.8K (All time)
- 194 (Last 30 days)
- 4.8 / 5
- Community
-
18 Feb 2026
- 4.8K (All time)
- 5 (Last 30 days)
- 4.1 / 5
- Community
-
9 Feb 2012

Prandtl-Meyer expansion wave solver
Numerical solution of a Prandtl-Meyer expansion wave flow field based on Anderson's CFD book
applications" from J.D.Anderson. As a result, this code might be useful for those trying to solve the problem, but also for anyone who is interested in supersonic aerodynamics.
- 1.7K (All time)
- 2 (Last 30 days)
- 4.5 / 5
- Community
-
15 Feb 2012
The chi-squared test.
Usage: [p, Q]= chi2test(x) The chi-squared test. Given a number of samples this function tests the hypothesis that the samples are independent. If Q > chi2(p, nu), the hypothesis is rejected
- 6.6K (All time)
- 2 (Last 30 days)
- 5.0 / 5
- Community
-
30 Aug 2007
Tests to Identify Outliers in Data Series
This document includes several statistical tests to identify outliers in data series.
identify suspicious observations that would require further analysis and also tests to determine if some observations are outliers. Nevertheless, it would be dangerous to blindly accept the result of a test
- 4.9K (All time)
- 1 (Last 30 days)
- 5.0 / 5
- Community
-
18 Aug 2010
Hybrid AC/DC & DC microgrid test system simulation
In this model, a Microgrid test system based on the 14-busbar IEEE distribution system is proposed.
Hz.This test system simulation includes:• One diesel generator,• Two photovoltaic (PV) systems,• Two battery energy storage system,• Various linear and non-linear loads.Additionally, the DC microgrid model
- 9.8K (All time)
- 71 (Last 30 days)
- 5.0 / 5
- Community
-
15 Feb 2021
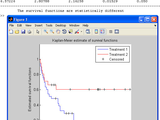
Comparing survival curves of two groups using the log rank test
Comparing survival curves of two groups using the log rank test.Comparison of two survival curves can be done using a statistical hypothesis test called the log rank test. It is used to test the null
- 5.5K (All time)
- 10 (Last 30 days)
- 4.6 / 5
- Community
-
3 Dec 2025
Raspberry Pi Board LED Test Utility
This is simple utility for Raspberry Pi board LED testing
- 677 (All time)
- 3 (Last 30 days)
- 5.0 / 5
- Community
-
9 May 2014

Source Panel Method applied to Flow around Cylinder
Source Panel Method applied to Flow around Cylinder. Example 3.19 from Anderson's book
Source Panel Method applied to Flow around Cylinder. Example 3.19 from Anderson's "Fundamentals of Aerodynamics". Serves as a good primer to CFD.
- 2.7K (All time)
- 9 (Last 30 days)
- 4.4 / 5
- Community
-
25 Mar 2016
Cochran's Q Test on dichotomous data for k-related samples
H = COCHRANQTEST(X) performs the non-parametric Cochran's Q-test on the hypothesis that the K columns of N-by-K matrix have the same number of successes and failures. H==0 indicates that the null
- 3.1K (All time)
- 8 (Last 30 days)
- 5.0 / 5
- Community
-
9 Oct 2007

A test for chaotic dynamics of a noisy time series based on the Lyapunov exponent.
This test performs the test for chaotic dynamics of a noisy time series based on the Lyapunov exponent. The input is a vector of observed time series which can be stochastic or chaotic, usually time
- 6.3K (All time)
- 4 (Last 30 days)
- 5.0 / 5
- Community
-
25 Jan 2018

A modified version of the Mann-Kendall Test that works with autocorrelated data.
Modified-MannKendall-TestReleased on MATLAB FileExchangeTo get started refer the file demo.mUseThe modified Mann-Kendall test is a hypothesis test that determines whether a given sequence of data has
- 355 (All time)
- 10 (Last 30 days)
- 5.0 / 5
- Community
-
28 May 2023

Cramer-von Mises test for goodness-of-fit of a single sample
Cramer-von Mises test for goodness-of-fit of a single sample based on the exact and asymptotic distribution of Csörgo & Faraway (1996).
- 1.2K (All time)
- 2 (Last 30 days)
- 5.0 / 5
- Community
-
22 Mar 2015
Mann-Kendall non-parametric trend test.
The code performs original two tailed Mann-Kendall test. It tests the null hypothesis of trend absence in the vector V, against the alternative of trend. The result of the test is returned in H = 1
- 14.3K (All time)
- 17 (Last 30 days)
- 3.7 / 5
- Community
-
9 Oct 2009
Generates test samples by randomly combining a known set of test data.
This is utility function used to generate test samples by randomly combining audio samples (encoded in wave format) located at a specified directory*[out save_dir] =
- 635 (All time)
- 1 (Last 30 days)
- 5.0 / 5
- Community
-
26 Oct 2012
Chi-square test - contingency tables
This function performs the chi-square test for 2x2 contingency tables
square test which is based on the chi square distribution. Thechi square test might become unreliable when the total number of expected frequencies(cell values in the contingency table) are not large
- 2.8K (All time)
- 1 (Last 30 days)
- 5.0 / 5
- Community
-
11 Feb 2008

The stationarity of a time series is evaluated by using the reverse arrangement test or moving-window functions
stationaryTestsMatlab functions to test the stationarity of a random processSummaryThe N-th order stationarity [1] of a random process is assessed using two tests. In the present submission, only the
- 1.2K (All time)
- 2 (Last 30 days)
- 4.5 / 5
- Community
-
8 May 2022

Efficient test for points inside a convex hull in n dimensions
Testing if a point is inside a convex hull can be done in a variety of ways. Inhull converts the problem into a dot product. If not supplied, it also computes the convex hull too. Inhull also
- 11.8K (All time)
- 2 (Last 30 days)
- 4.7 / 5
- Community
-
6 Sep 2012