3,071 results

Simple user interface with possibility to pick any color and determine MATLAB code for chosen color.
Simple user interface with possibility to pick any color and determine MATLAB code for chosen color. It makes possible to copy determined color code en paste it to your color specification within
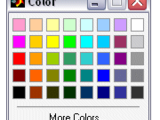
MS Office Style Color Picker
who downloaded my UiColorPicker before 9/6/03 should download this file as replacement).

Slider widget that responds to dragging realtime.

A compact color picker
The selectcolor function is a compact alternative to uisetcolor. It places some 'quick selection' color choices into a single window with sliders and edit boxes to manually adjust RGB channel values

webColor 141色の一覧表示と、クリックで色取得ができます
webColor に、色の一覧表示とクリックで色取得できるUIを付けてみました。function customColorPicker() % Define custom colors webcolor = createWebColorStruct(); colorNames = fieldnames(webcolor); customColors =

MATLAB Image Manipulation Toolbox
functionality.Let me know if you find bugs. Highlights:GUI extensions of several core functionsPassthrough/fallback replacements for several IPT toolsMulti-model color picker GUIGUI for parametric color-based mask

Many-featured, platform independent file and directory picker.

User draws region and this finds pixels in the image with a similar color, using Delta E.
Demo to perform very, very simple color detection in LAB color space. The RGB image is converted to LAB color space and then the user draws some freehand-drawn irregularly shaped region to identify a

RGB to color name. Color name to RGB. Supports many palettes: CSS, dvips, HTML, MATLAB, RAL, SVG, X11, xcolor, xkcd,...
One function converts between RGB and color names, in both directions.The function COLORNAMES accepts either RGB values or color names as its inputs, and returns the color names and RGB values from
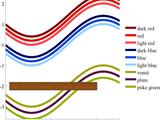
RGB triplets for 949 colors, by how they're perceived on a computer monitor and their common names.
This function returns the RGB triplet for almost any color. And unlike the way colors are somewhat officially defined (http://en.wikipedia.org/wiki/Web_colors), this data set describes returns

The frequency image is where the pixel intensity represents the frequency of the same color pixels.
This is a MATLAB implementation of the Color Frequency concept introduced by T. Kashiwagi & S. Oe.With this script, you pick a color image and then it computes the color frequency image. The
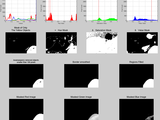
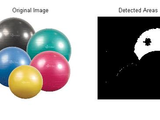
Detect colored regions in an image via thresholding in HSV color space.
This script is a demo that shows you how to find objects of a certain color in an image. For this example I'm using the standard onion, peppers, or kids image that ships with the Image Processing

Displays sprintf-formatted strings in the Command Window using the specified color/underline/bold style
cprintf command.STYLE colors can be specified in 3 variants: [0.1, 0.7, 0.3] - standard Matlab RGB color format in the range 0.0-1.0 [26, 178, 76] - numeric RGB values in the range 0-255 '#1ab34d

Fast edges of a color image (actual color, not converting to grayscale)
Version 1.1.0.0
Joao HenriquesEdges of a color image by the max gradient method.
Extracts the edges of a color image without converting it to grayscale.Changes in color are detected even when the grayscale color of two pixels are the same. The edge strength is typically greater

Matlab code to plot color histograms and color clouds
Usage: createColorHistograms(im_str)im_str can be an image file location or a three-dimensional arrayThere seem to be two confounds in plotting color histograms. One is the obvious one of showing a

Returns a Matlab RGB color specifier corresponding to a given color name (139 colors supported).
RGB = RGB('COLORNAME') returns the red-green-blue triple corresponding to the color named COLORNAME by the CSS3 proposed standard [1], which contains 139 different colors (an rgb triple is a 1x3

Helps digitize graph data from an image.
Create tints of colors and colormaps
Create specified tints of colors and colormaps or show examples of tints.To create shades, see http://www.mathworks.com/matlabcentral/fileexchange/47245-color-shades

Create color maps from actual names that people use for colors.
viewers more than 900 of the most commonly-used colors on the internet, and getting users to use their own words to describe that color. The result is a database of the most commonly-used names for colors

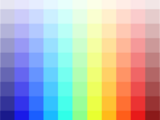
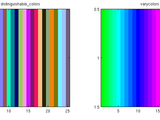
Generate maximally-distinct colors in an RGB colormap.
: https://en.wikipedia.org/wiki/Oklab_color_spaceOptional input arguments allow the user to:Limit the lightness range.Limit the chroma range.Provide a colormap of colors to be excluded (e.g. background colors, existing plot colors).Provide a colormap of

This program just tracks all red color objects and draws a bounding box around them.
This program just tracks all red color objects and draws a bounding box around them. This works on the difference between frames concept. Every frame in the video is returned as an rgb image on which

Script to do simple color detection in RGB color space. Finds red objects in the image.
This script is a demo that shows you how to find objects of a certain color in an image. For this example I'm using the standard onion, peppers, or canoe image that ships with the Image Processing
Color Tools for MATLAB is an experimental collection of MATLAB functions related to color science computation and visualization.
Color Tools for MATLAB is an experimental collection of MATLAB functions related to color science computation, color scales, visualization, and ICC color profiles. It is meant to supplement the
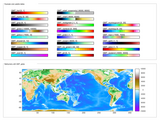
Create and apply GMT-style colormaps in Matlab
## cptcmap.m DocumentationAuthor: Kelly Kearney[
Converts a gray image to color image
This program converts a gray image to color image. The conversion is based on color image submitted along with the input gray image. Actualy it transfers color to a grayscale image. The

Colour toolbox that accompanies the second edition of Computational Colour Science using MATLAB
Colour toolbox that accompanies the second edition of Computational Colour Science using MATLAB (Westland, Ripamonti and Cheung, 2012).Toolbox allows spectral interpolation, calculation of colour
Efficient identification of color names for any RGB
Yes, its easy to identify [1, 0, 0] as a red color. But sometimes we want to find ALL colors in an image that we would identify as red. Thus, [1, 0.1, 0.1] is also easily seen as red by the eye. Its
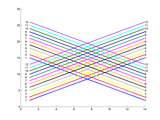
Choose a set of n colors that can be readily distinguished from each other
When plotting a set of lines, you may want to distinguish them by color. By default, Matlab chooses a small set of colors and cycles among them, and so if you have more than a few lines there will be

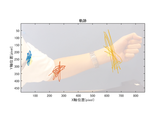
PPHASEPICKER is a powerful tool for automatically picking P-phase onsets.
: Kalkan, E. (2016). “An Automatic P-phase Arrival Time Picker“, Bull. of Seis. Soc. of Am., 106(3): 971-986, doi: 10.1785/0120150111.
Updated code hatch with color and inverted hatches

This function can be used to create various plots of Lab color coordinates.
The plot_Lab function is a simple tool to create nice-looking Matlab figures of CIE-L*a*b* color coordinates of a set of data samples.Features:-> plots can be created in true-color (each datapoint
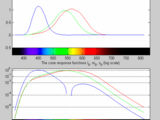
Label plots with spectra. Convert wavelengths to RGB. Functions for color matching and illuminants.
This is the beginning of a set of functions for working with color as wavelengths (spectral color) and in the xyY and XYZ color spaces.Current functionality includes:spectrumLabel - Add a color bar

The complete palette of ColorBrewer colormaps. Simple selection by scheme name and map length.
BREWERMAP Function==================[
Easily customize MATLAB’s color settings by selecting and applying color schemes from MATLAB Color Theme Extensions.
# MATLAB Color Theme Extensions[
Open-source data-driven hydrogeological insights

P-PHASE ARRIVAL TIME PICKER BASED ON AKAIKE INFORMATION CRITERION
Version 1.0.0.0
Dr. Erol Kalkan, P.E.Computes P-phase arrival time in windowed digital single-component seismic recording using AIC
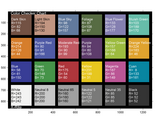
Synthesize a perfect version of the X-Rite Color Checker chart.
The X-Rite Color Checker Chart is a very common standard used for standardizing different images and imaging systems. (This chart has been known in the past as the Gretag Macbeth Color
Several color conversion and graphic tools to play around with
Several color conversion and graphic tools to play around with There are mainly three functionalities1) conversion between color spaces (RGB, HSV, HSL, XYZ, xyY, Lab), here nothing new2) Constructing

Generate vertices, faces and color for u3d format and display it in pdf or doc, xls and ppt
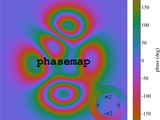
A constant-lightness cyclic colormap for phase.
lightness is good for displaying phase because it does not put strong emphasis on any part of the color map. A well-written and aesthetically-pleasing overview of Kristen's cmocean colormaps can be found
A colormap that attempts to be color blind friendly
This is a .mat file that contains 12 colors specified by Matlab color triplets. The file contains a matrix of colors(each row is 1 color) as well as a matrix of the names for each color. The names
Color marker based object tracking for video analysis using Kalman filter
This demo shows a color marker based object tracking for video analysis. You can use a custom color mask function created by using colorThreshoulder app.The tracking performs robustly because missing

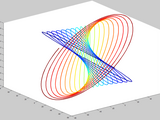
Plots a 3D line with color encoding along the length using the patch function.
This function plots a 3D line (x,y,z) encoded with scalar color data (c). This function is an improvement over the CLINE function previously made available on TMW File Exchange. Rather than using

Color image segmentation
We propose a superpixel-based fast FCM (SFFCM) for color image segmentation. The proposed algorithm is able to achieve color image segmentation with a very low computational cost, yet achieve a high

guiDatePicker replaced the activeX module mscal.ocx which didn't work with Win7(64 bit)
Function call:s = guiDatePicker('1-Jan-2011');Select a date and close the GUI. S is the "datenum" of the selected date and time.
Color Detection Using HSV Color Space (Training and Testing)
Version 1.0.0.0
Theodoros GiannakopoulosThe provided Matlab functions demonstrate a simple method for training and testing a color detection
The provided Matlab functions demonstrate a simple method for training and testing a color detection system. In general, a color detection algorithm searches an image for pixels that have a specific
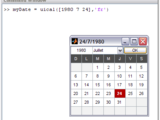
A new calendar date picker using nested functions
UICAL is an implementation of a calendar date picker which uses the power of the nested functions.UICAL is easily customizable in terms of colors and even languages. In fact you can easily add you
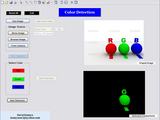
RGB Color Detection in Images Real Time Video
RGB color detection in images and Real time video is presented in this project.# Color Detection in Image 1. Click on Use Image 2. Select image source *Demo Image (Already in files) *Browse
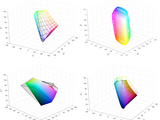
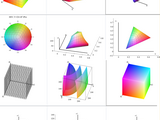
This tool helps to visualizes color volume by constructing a 3D gamut(s) given point cloud of color values.
This tool helps to visualizes color volume by constructing a 3D gamut(s) given point cloud of color values.Please visit GitHub page (https://github.com/QiuJueqin/Yet-Another-Color
Plot a 2D or 3D line using a specified colormap.
color% does NOT depend on any coordinate.% Technically, length(colormap) lines are plotted, each with a different% color from the colormap in ascending order.% H is a handle to the complete

Apply and save color schemes in MATLAB with ease.
MATLAB Schemer makes it easy to change the color scheme (a.k.a. theme) of the MATLAB display and GUI.You can use Schemer to import a predefined color scheme, transfer your color settings between
Toolbox for working with simple, undirected graphs

This function provides a color filtering of a given image.

Standard Matlab jet color palette extended to black (minimal) and white (maximal) ranges.
Standard Matlab jet color palette does not contain black/white colors while it is natural to present by these colors minimal/maximal values. This is done in presented extended jet palette. Limitation
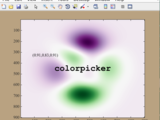
Get RGB values of any point(s) on a figure from mouse click(s)
thetemporary RGB labels. RGB = colorpicker(...) returns RGB values of all clicks while the color picker is open. If only one output is requested, RGB values a an N-by-3array, where N is the number of clicks

Implements the MATLAB given quiver/quiver3 function adding a color coding depending on magnitude
%quiverC3D creates a 3D quiver plot and adds a color coding. The color coding is%given by the magnitudes of the component vectors. Large values result in colors %from the upper end of the used

gray2rgb converts a gray image to RGB based on the colors of the source image
and rewritten to more closely achieve what was described in the paper "Transfering Color to Grayscale Images" by Welsh, Ashikhmin and Mueller. Identical results to Rajan's code are achieved much more
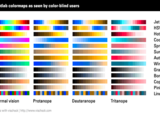
This image provides simulations of how the standard Matlab colormaps look to color-blind users.
The choice of colormaps for data visualization can affect the information accessible to color-blind users. For example large patches of cyan in an image with a bitonal cyan-magenta colormap (Matlab

Automatically cluster a Color or Gray image. No need for specify number of cluster.
This algorithm is a fully automatic way to cluster an input Color or gray image using kmeans principle, but here you do not need to specify number of clusters or any initial seed value to start
You can also select a web site from the following list
Americas
- América Latina (Español)
- Canada (English)
- United States (English)
Europe
- Belgium (English)
- Denmark (English)
- Deutschland (Deutsch)
- España (Español)
- Finland (English)
- France (Français)
- Ireland (English)
- Italia (Italiano)
- Luxembourg (English)
- Netherlands (English)
- Norway (English)
- Österreich (Deutsch)
- Portugal (English)
- Sweden (English)
- Switzerland
- United Kingdom (English)
Asia Pacific
- Australia (English)
- India (English)
- New Zealand (English)
- 中国
- 日本Japanese (日本語)
- 한국Korean (한국어)