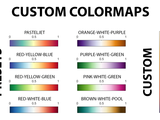
This function is able to define a customized colormap given the positions and the colors that are required to make the gradients.
The function defines a customized colobar given the positions and the colors that are going to generate the gradients. A Live Script example is also provided to understand the following parameters
Buillds any sequence of colormaps based on wrgbcmyk colors
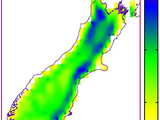
This function can be used to build your own custom colormaps. Imagine if you want to display rainfall distribution map. You want a colormap which ideally brings rainfall in mind, which is not
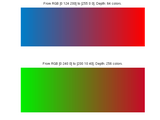
COLORGRADIENT allows you to generate a linear color gradient from color A to color B.
User can generate a custom linear colormap giving 2 colors and colormap depth.Colors are given as vectors with RGB values. The suggested input method is using intensity values for each channel (0,1
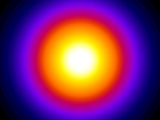
Use the 'fire' colormap in Matlab, or create your own.
, FLAG, PINK, COLORMAP, RGBPLOT.To create any custom colormap, see the directions on line 23 of this m-file.
Create custom colormaps from single or multiple RGB values.
CMAP creates a custom colormap based on RGB values in the MATLAB format(values between 0-1). By specifying a base color, for example green: [0 1 0], CMAP creates a colormap with a specified number of

Create positive-zero-negative colormap and colorbar. Customized colormap/colorbar options are available.
COLORBARPZN creates positive-zero-negative colormap and colorbar.Zero is in white if while color location is not specified.Customized colormap/colorbar options are available for: - automatic/manual
sets the colormap according to monotonically increasing user defined ranges
This function is useful if you don't want to use the linear scaled colormap that are the default in Matlab. USAGE: CUSTOMCMAP(cbar_labels,user_cmap,minMaxValues

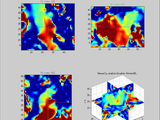
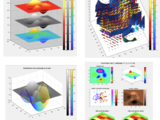
Lets you easily zoom into Mandelbrot set (2D/3D)
of the Mandelbrot set. The Mandelbrot set contains 3 custom colormaps that will generallysuit Mandelbrot set more than the existing standard repertoire ofcolormaps. Changes since the last version
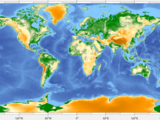
Customized colormap for clear surface height/oceanic depth overview.

Extension of jet colormap to include more colors. It can also be used to build virtually any custom colormaps.
Superjet is a general function for colormap building. I originally wrote it back in the days when jet was the default colormap and it was designed as an extension of jet to include black and white

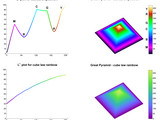
Creates a custom color map given the RGB triplet array.
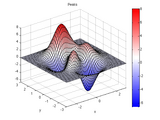
Introduction Creates a custom colormap given the RGB triplet array.Quick Pipeline VisualizationExample: Colormap from [Blue green yellow red] color array.Peaks function with [B G Y R

Make Color Map - Easily define custom colormap. Accepts any type of input, and has options for light-dark maps and unique inbuilt colormaps.
mcm - Make Color MapEasily make colormaps with an input array of color values, designed to be simple to use and is ideal for beginners. mcm() accepts numeric/rgb and hexidecimal as arrays where the

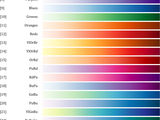
color_shades allows you to easily create custom colormaps using different colors from the rgb function (link in the description).
Create your custom colormap using the listed colors within the rgb function (required; download from
An adjustable multiple-colour gradient colour map generator / editor for MATLAB, with presets.
This script allows you to generate a colour scale (as for colormap, colorbar) using any number of custom colours, and allows you to arrange these colours by adjusting their relative positions with

build custom colormap
colormap=rgbmap(c_1,c_2,...,c_n,N,opt,graph); input: c_1,c_2,...,c_n - color variables: vectors, matrix(nx3) or strings (if 'rgb' function is available)N - colormap length (default N=64)opt='natural

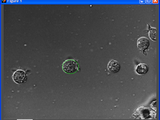
Mix color and black and white in the same picture -custom colormaps
Version 1.2.0.0
Vijay SwaminathanThis GUI will allow you to take a color image and set regions of it to be black and white.
regions will retain the original color while the rest of the image will appear black and white. This demo illustrates how to get around the limitation of MATLAB® figures of not allowing two colormaps for
4D (3D+1) volume visualization with windowing, custom colormaps, and component selection
with a built-in 'slice' visualization. The user may also supply a cell array of colormaps, which populate a menu within the gui.
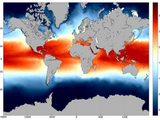
A colormap from bright blue, through white, and then to bright red.
REDBLUE(M), is an M-by-3 matrix that defines a colormap.The colors begin with bright blue, range through shades of blue to white, and then through shades of red to bright red. REDBLUE, by itself, is
200 colormaps

Simple scatter function with heatmap. Allows for custom colormaps.

Create a custom RGB colormap by interpolating between two pre-defined extremes.
MAPCOLORS Create a custom RGB colormap by interpolating between two pre-defined extremes. MAPCOLORS(START,FINISH) returns a 64 x 3 matrix containing RGB intensities linearly interpolated

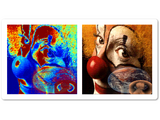
Create custom color maps for charts from the colors found in photographs and paintings.
ArtToColormap was written to improve visual communication of scientific data. ArtToColormap.m - build a color map or manage existing ones.getCMap.m - apply colors to a chart."What palette of colors
Extra colormaps for plotting. Contains diverging, sequential, categorical, and perceptual maps.
This is an embarrassingly simple function to augment the currently available MATLAB colormaps. It works as a seamless replacement for the current maps like jet and hsv. So to use it you just call
Use multiple colormaps per figure or axis! Works for many types of objects, not only images.
freezeColors/unfreezeColorsfreezeColors allows multiple colormaps to be used per figure and even within a single axis.HistoryIn 2005 freezeColors was written to enable multiple colormaps in a single
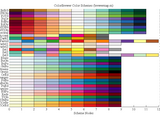
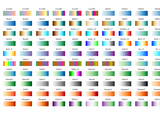
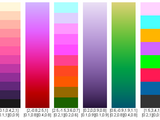
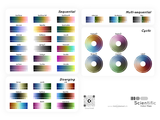
The complete palette of ColorBrewer 2.0 colormaps. Simple selection by scheme name and map length.
BREWERMAP provides all ColorBrewer 2.0 colorschemes for MATLAB, with simple selection by colormap length and colorscheme name. Alternatively the colorscheme name can be preselected, after which only

Build custom colormaps
This function can be used to build your own custom colormaps.the first input argument colors is a n X 3 matrix with each row specifying the color.the second argument is the resolution of the colormap
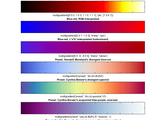
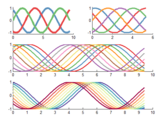
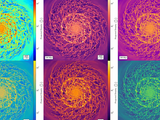
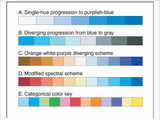
7 perceptual colormaps with rainbow-like colors and 1 with heat colors
PMKMP Returns perceptually balanced colormaps PMKMP(N,SCHEME) returns an Nx3 colormap. usage: map=pmkmp(n,scheme);%% Example1: 128-color rainbow with cubic-law luminance (default) load mandrill
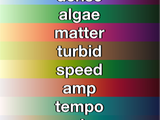
Perceptually-uniform colormaps inspired by oceanography
These colormaps were developed by Kristen Thyng using viscm. They are perceptually uniform, as color should be when it serves as a numeric axis. If these colormaps are useful for you, please consider
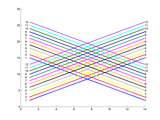
Plot lots of lines with very distinguishable and aesthetically pleasing colors. Works for 'N' colors
The default Matlab default line spec and colormaps are astoundingly crude. This function creates distinguishable colors by spacing them out ~equally in *perceptive* space, not in RGB space. It is
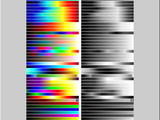
A versatile implementation of the CubeHelix algorithm to create colormaps (suitable for grayscale conversion)
CUBEHELIX generates colormaps for published or distributed documents as they are very attractive in full color and yet are suitable for grayscale conversion.CUBEHELIX creates different colormaps

This simple code enables you to plot using custom markers.
This simple code enables you to plot using custom markers. It uses custom patches instead of Matlab built-in markers.As the input, you need to provide x and y for the data points, like you do in

MATLAB Code for Interactive Magnification of Customized Regions.
ZoomPlotMATLAB Code for Interactive Magnification of Customized Regions.Version 1.5.1, 5-FEB-2024Email: iqiukp@outlook.com✨ Main featuresEasy application with just two lines of codeInteractive
A figure ready to scroll through and play videos. You can also draw any custom graphics on it.
redraw at scroll position F (for example, REDRAW_FUNC can show the frame F of a video).This can be used not only to play and analyze standard videos, but it also lets you place any custom Matlab plots and
MATLAB color utilities including COLORMAP join and interpolation; freeze and fit COLORBAR, etc.
These are some utilities that improve the COLORMAP and COLORBAR functions. They are as follows, and each one includes help and examples: COLORMAP utilites:cmapping - Colormap linear
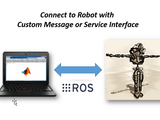
Use custom ROS message and service types in MATLAB and Simulink.
Note: This support package is functional for R2017a to R2020a. Starting in R2020b, ROS custom message generation is directly supported from ROS Toolbox without this support package. Using the ROS
Perceptually uniform scientific colormaps from Fabio Crameri.
AboutA simple Matlab function for Fabio Crameri's perceptually uniform scientific colormaps.Usagecrameri without any inputs displays the options for colormaps.crameri ColormapName sets the colormap
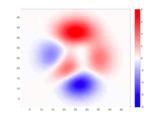
A colormap generator to display positive values as blue and negative values as red. Zero is displayed as either white or black.
white or black. The clim values, from the image or can be entered, are used to customize the colormap.Syntax: y = redblue(n,clim,'black')Typical usage: colormap(redblue(64))Arguments:All arguments are
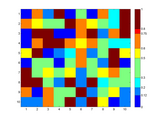
ColormapsNc lets you create your own colormaps (up to 256 colors).
ColormapsNc lets you create your own colormaps (up to 256 colors).ColormapsNc is able to create a custom colormap by specifying up to 256 different colors. The colors will be shown in the order you

Transform an image to have any histogram you want.
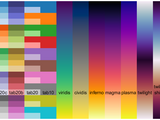
MatPlotLib's default perceptually uniform colormap VIRIDIS and distinctive line ColorOrder TAB10
From MatPlotLib 2 and 3:the default sequential colormap VIRIDIS (as well as INFERNO, MAGMA, and PLASMA).the default line colororder TAB10 (as well as TAB20, TAB20B, and TAB20C).the perceptually
Class of matrix-like objects with on-the-fly definable methods.

Colormap in blue, white and red.
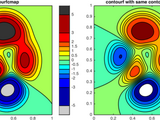
Creates a filled contour plot, with more precise control over colors than contourf.
contourfcmap.m: filled contour plot with precise colormapAuthor: Kelly KearneyThis repository includes the code for the contourfcmap.m Matlab function, along with all dependent functions required to
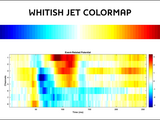
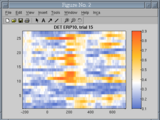
Jet-based colormap that contains white in its middle point.
This function defines a new colormap with the same colors that "jet", but it also replaces the green tones with white ones. This is specially useful when a signed metric is depicted, and its null
GINPUT with customizable cursor.
This function behaves similarly to MATLAB's GINPUT, with an added ability to customize the cursor color, line width, and line style. From the function HELP:[X,Y] = ginputc(N) gets N points from the
Easily design and fit a colormap to the values in your data!
Tristan Ursell Nov 2013 Adaptive colormap rgbslide(mat_in,...) slide_map = rgbslide(...); This function creates, on the fly, an active / adaptive colormap for the data given by the matrix
A colormap with colors orange-white-light blue.
A colormap with colors orange-white-light blue. The length of the colormap can be defined with additional parameters (e.g. colormap(esa(256)).
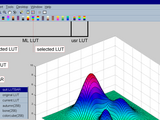
LUTBAR creates a colormap toolbar and context menu
if you are tired of trying colormap(xxx) at the command prompt to find the appropriate colormap for your figure - try LUTBARLUTBAR creates a colormap toolbar with colormap icons and context menu from

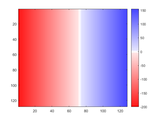
Blue, white, and red colormap for images with positive and negative values.
BLUEWHITERED(M) returns an M-by-3 matrix containing a blue to white to red colormap, with white corresponding to the CAXIS value closest to zero. This colormap is most useful for images and surface
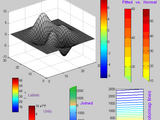
Create multiple colormaps and colorbars in (seemingly) the same set of axes.
This function creates a new set of invisible axes matching the size and extents of the current axes. This allows additional colormaps to be used in such a way that they are perceived as multiple
Performs advaced colormap operations
Length Length of generated colormap ColorPositions Vector of color positions If colors from the ColorMapString should be placed at custom data values, provide their
Makes colormaps that smoothly blend from one color to another to optionally a third.
Many colormaps like Jet cause your eye to misunderstand important characteristics of your data. It is often best to simply blend from one color to another, or possibly through three. This file will

Customized tick marks, maintained on zoom and pan
Allows automatically-updating customized tick marks in Matlab
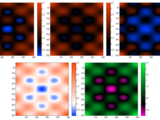
Superimpose multiple semitransparent images with individual colormaps on the current axis.
Remaps CData for multiple images, plotted in the current axis, to their respective individual colormaps. Multiple examples provided. The examples also demonstrate how semitransparent effects can be

Generates one of four colormaps using schemes proposed in technical literature
A colormap that attempts to be color blind friendly

Use your custom line style
Use your custom line style with function named plot_dashYou can design your line pattern and its length by the parameter spec_ and num_For instance, Matlab default dashed line ∽ spec_ = [1, 0.5], n
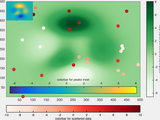
Colormap with zero-center white shading.
When representing "polarized" data for which zero and sign are meaningful (like for instance, a gravity anomalies map), it is useful to have a colormap where white stands for zero value, and greater
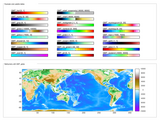
Create and apply GMT-style colormaps in Matlab
cptcmap.m DocumentationAuthor: Kelly KearneyThis function creates and applies a colormap defined in a color palette table (.cpt file). Color palette files provide more flexible colormapping than
You can also select a web site from the following list
Americas
- América Latina (Español)
- Canada (English)
- United States (English)
Europe
- Belgium (English)
- Denmark (English)
- Deutschland (Deutsch)
- España (Español)
- Finland (English)
- France (Français)
- Ireland (English)
- Italia (Italiano)
- Luxembourg (English)
- Netherlands (English)
- Norway (English)
- Österreich (Deutsch)
- Portugal (English)
- Sweden (English)
- Switzerland
- United Kingdom (English)
Asia Pacific
- Australia (English)
- India (English)
- New Zealand (English)
- 中国
- 日本Japanese (日本語)
- 한국Korean (한국어)