Image correspondences using cross-correlation
Find matching features in pairs of images using normalised cross-correlation: class file and demo.
- 9.9K (All time)
- 6 (Last 30 days)
- 4.9 / 5
- Community
-
9 Dec 2011
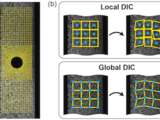
2D Finite Element Global Digital Image Correlation (FE-DIC)
Finite-element-based global DIC method (guarantee global kinematic compatibility and decrease noise by adding regularization penalties).
- 2.4K (All time)
- 9 (Last 30 days)
- 5.0 / 5
- Community
-
20 Jan 2024

Augmented Lagrangian Digital Image Correlation and Tracking
2D-AL-DIC(Augmented Lagrangian DIC) is a fast, parallel-computing DIC algorithm which also considers global kinematic compatibility.
- 4.1K (All time)
- 15 (Last 30 days)
- 5.0 / 5
- Community
-
26 Mar 2024

Finite Element Global Digital Volume Correlation (FE-DVC)
Finite-element-based global DVC method (guarantee global kinematic compatibility and decrease noise by adding regularization penalties).
- 1.4K (All time)
- 3 (Last 30 days)
- 5.0 / 5
- Community
-
15 Jul 2021

HHT transform for one-dimensional signal. Contains Empirical mode decomposition (EMD) program.
- 2K (All time)
- 7 (Last 30 days)
- 4.8 / 5
- Community
-
3 Aug 2019

This exercise shows how the method of linear predictive coding (LPC) models a speech frame.
- 1.4K (All time)
- 3 (Last 30 days)
- 5.0 / 5
- Community
-
2 Jun 2015

IMF for Bearing Fault Diagnosis
performs HHT on signal & IMF is plotted for Condition monitoring of vibration based bearing fault
- 4.8K (All time)
- 3 (Last 30 days)
- 4.8 / 5
- Community
-
19 Jun 2012

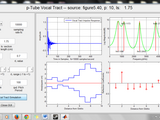
This exercise computes the frequency response of a p-tube model of a human vocal tract.
- 977 (All time)
- 1 (Last 30 days)
- 5.0 / 5
- Community
-
23 Jun 2015

- 7.3K (All time)
- 2 (Last 30 days)
- 4.8 / 5
- Community
-
4 May 2016

Fast Checkerboard Demodulation for digital Schlieren imaging
Track optical distortions in a checkerboard pattern with high accuracy in real-time using the FCD method
- 383 (All time)
- 3 (Last 30 days)
- 5.0 / 5
- Community
-
9 Dec 2018
This submission is a realization of the Hilbert-Huang transform (HHT).
with spsnip_gui available at http://www.mathworks.com/matlabcentral/fileexchange/loadFile.do?objectId=11002&objectType=FILE.Essential files: plot_hht.m, emd.m, findpeaks.mAccompanying files: Hum.wav
- 43.3K (All time)
- 14 (Last 30 days)
- 4.7 / 5
- Community
-
31 Mar 2016
- 227 (All time)
- 8 (Last 30 days)
- 5.0 / 5
- Community
-
15 Feb 2024
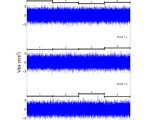
Continuous Sound and Vibration Analysis
This program analyzes sound and vibrations data using metrics for continuous noise and vibrations.
- 8.7K (All time)
- 4 (Last 30 days)
- 4.5 / 5
- Community
-
4 Dec 2013
Matlab toolbox for separation techniques hyphenated high resolution mass spectrometry
- 222 (All time)
- 1 (Last 30 days)
- 4.0 / 5
- Community
-
21 Apr 2022

Segmented peak finder findpeaksSG.m
Peak finder for signals containing peaks of widely variable widths.
Segmented peak finder, findpeaksSG.mn, has the same syntax as findpeaksG.m, except the 3rd to 6th input arguments can be vectors with one entry for each segment. function
- 307 (All time)
- 1 (Last 30 days)
- 5.0 / 5
- Community
-
19 Nov 2016
Find peaks in vector
Specify a vecter, a minimum peak separation, and a minimum peak height, and this function will find the peaks.. about 250 times faster than findpeaks
- 4.1K (All time)
- 4 (Last 30 days)
- 4.4 / 5
- Community
-
17 Jan 2011

peaks2 - find peaks in 2D data without additional toolbox
Find peaks in 2D data just as with Matlab's 'findpeaks' function
filters can be selected such as the minimal absolute value or threshold above the immediate surroundings etc.It mimicks the same syntax as Matlab's own 'findpeaks' function but does not require any
- 1.3K (All time)
- 13 (Last 30 days)
- 4.3 / 5
- Community
-
12 Apr 2023

- 6.9K (All time)
- 2 (Last 30 days)
- 3.7 / 5
- Community
-
23 Dec 2018

Dielectric characterization by microwave cavity perturbation
A custom toolbox and example code to measure complex permittivity by microwave cavity perturbation
- 698 (All time)
- 1 (Last 30 days)
- 4.0 / 5
- Community
-
28 Aug 2014

Signal Optimal Smoothing Techniques
Producing high- and low-resolution smoothers by means of Spectral Analysis
- 774 (All time)
- 3 (Last 30 days)
- -- / 5
- Community
-
2 May 2017

- 189 (All time)
- 2 (Last 30 days)
- -- / 5
- Community
-
11 Sep 2015

Illustrates vocal tract response, glottal pulse, radiation response for voiced and unvoiced speech
- 1.1K (All time)
- 1 (Last 30 days)
- -- / 5
- Community
-
16 Jun 2015
- 721 (All time)
- 2 (Last 30 days)
- -- / 5
- Community
-
2 Jun 2014

This exercise plots wideband and narrowband speech spectrograms for a user-designated speech file.
- 3.1K (All time)
- 4 (Last 30 days)
- -- / 5
- Community
-
25 Jun 2015

- 2 (All time)
- 1 (Last 30 days)
- -- / 5
- Community
-
9 Feb 2021

This exercise utilizes four programs to train a Bayesian classifier and classify frames of signals.
- 1.8K (All time)
- 2 (Last 30 days)
- -- / 5
- Community
-
16 Jun 2015
- 76 (All time)
- 2 (Last 30 days)
- -- / 5
- Community
-
20 Jan 2023

- 11 (All time)
- 3 (Last 30 days)
- -- / 5
- Community
-
2 Oct 2024
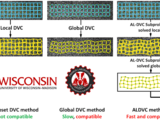
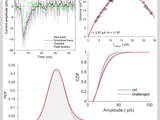
Augmented Lagrangian Digital Volume Correlation (ALDVC)
Adaptive Lagrangian Digital Volume Correlation - volumetric displacement and strain measurement based on a hybrid local-global approach
- 2K (All time)
- 1 (Last 30 days)
- 5.0 / 5
- Community
-
9 Mar 2024

VUS-Voiced/Unvoiced/Silence_Training
This exercise utilizes four programs to train a Bayesian classifier and classify frames of signals.
- 1.2K (All time)
- 1 (Last 30 days)
- 5.0 / 5
- Community
-
14 Jul 2015

peaks - 1D peak finding without Signal Processing Toolbox
Find peaks in 1D data | Matlab findpeaks equivalent
surroundings or predefined minimal spacing between the peaks.It's a replacement for Matlab's proprietary 'findpeaks' function using the same syntax. Does not require any additional Matlab toolbox, just the base
- 93 (All time)
- 3 (Last 30 days)
- -- / 5
- Community
-
3 Apr 2023
Function for finding peaks from data array
Function helps in finding the peaks more effectively than findpeaks() defined in Matlab library.
I was not able to get the peaks from my experimentally obtained data because of its random nature. As a result the findpeaks() defined in Matlab library was not giving results as expected. Hence I
- 1.1K (All time)
- 1 (Last 30 days)
- -- / 5
- Community
-
20 Jun 2010
- 2K (All time)
- 4 (Last 30 days)
- 2.0 / 5
- Community
-
26 Mar 2014

Plug-in substitute for findpeaks(). Uses parabolas to interpolate to estimate "true" peaks.
findpeaksInterp(): Estimate peaks by parabolic interpolation. Finds the parabola passing through each peak found by findpeaks() and the two neighboring points. Returns the x,y coordinates of the
- 206 (All time)
- 1 (Last 30 days)
- -- / 5
- Community
-
11 Dec 2021
- 250 (All time)
- 1 (Last 30 days)
- -- / 5
- Community
-
26 Sep 2016

- 70 (All time)
- 1 (Last 30 days)
- -- / 5
- Community
-
29 Aug 2016
- 3.4K (All time)
- 1 (Last 30 days)
- -- / 5
- Community
-
28 May 2014
- 168 (All time)
- 1 (Last 30 days)
- -- / 5
- Community
-
11 Sep 2015
- 1.3K (All time)
- 1 (Last 30 days)
- -- / 5
- Community
-
26 Oct 2007

- 10.8K (All time)
- 8 (Last 30 days)
- 5.0 / 5
- Community
-
18 Oct 2010

This exercise computes the frequency response of a three-tube model of a human vocal tract.
- 1.1K (All time)
- 1 (Last 30 days)
- -- / 5
- Community
-
16 Jun 2015

- 1.3K (All time)
- 1 (Last 30 days)
- -- / 5
- Community
-
16 Jun 2015

This exercise compares three algorithms for computing the complex cepstrum of two finite sequences.
- 1K (All time)
- 1 (Last 30 days)
- -- / 5
- Community
-
16 Jun 2015

A simple way to visualize and understand speech waveforms by plotting and examination.
- 792 (All time)
- 1 (Last 30 days)
- -- / 5
- Community
-
16 Jun 2015
- 1 (All time)
- 1 (Last 30 days)
- -- / 5
- Community
-
17 Apr 2024

Tool to analyze two-photon calcium imaging videos, extract neuronal activity, and identify neuronal ensembles (ONsembles and OFFsembles).
- 22 (All time)
- 1 (Last 30 days)
- -- / 5
- Community
-
24 Apr 2024

- 1.4K (All time)
- 1 (Last 30 days)
- -- / 5
- Community
-
2 May 2012

- 5.6K (All time)
- 5 (Last 30 days)
- 4.0 / 5
- Community
-
27 Sep 2010

Complements find peaks function with the possibility to find all peaks, both local maximums, and local minimums.
Besides complementing find peaks function with the possibility to find all peaks, both local maximums, and local minimums.This also provides a possible workaround for the findpeaks bug pointed out by
- 687 (All time)
- 2 (Last 30 days)
- 5.0 / 5
- Community
-
18 Jan 2020
- 2.1K (All time)
- 2 (Last 30 days)
- -- / 5
- Community
-
24 Sep 2010

- 1.5K (All time)
- 1 (Last 30 days)
- -- / 5
- Community
-
3 Oct 2010
Find local peaks in a signal
Efficiently finds local maxima in a signal (NlogN time) - these are defined as points in which are the higher than any other point within a specified range.Matlab's "findpeaks" has a slightly
- 358 (All time)
- 1 (Last 30 days)
- -- / 5
- Community
-
2 May 2012

- 2K (All time)
- 1 (Last 30 days)
- 5.0 / 5
- Community
-
18 Oct 2010

Finding local maxima's and minima's of a curve
This mfile finds local maxima's and minima's of a curve. The bugs have been fixed in this version.
to find local maxima and minima and is % optional, it has four elements: [x_min x_max y_min y_max]% output: is the xy position of local maxima's and minima's% SEE ALSO findpeaks
- 2K (All time)
- 1 (Last 30 days)
- 4.0 / 5
- Community
-
9 Apr 2013
Find Peaks of the signal and stores the answer in excel
find peaks program to find peaks i have faced problem in findpeaks.m so i have made my code to find peaks of the signal. it find peaks of the signal from excel file and stores peaks value in excel
- 631 (All time)
- 1 (Last 30 days)
- -- / 5
- Community
-
29 Jul 2013
Automated Frequency Domain Decomposition (AFDD)
Modal parameters identification from ambient vibrations measurement using the FDD
]. For the automated procedure, I am using the peak picking function “pickpeaks” developed by [5] and available in [6], which was much more efficient than the Matlab function "findpeaks" for this purpose
- 4K (All time)
- 15 (Last 30 days)
- 5.0 / 5
- Community
-
27 Jan 2023
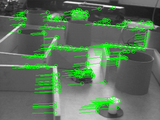
Digital Image Correlation and Tracking
Calculate displacement and strain from a series of images
windows systems so far. Linux Users need to copy cpcorr.m and findpeak.m into their work folder and change it there. After renaming it (e.g. cpcorr2.m) the calling lines should be changed, too, in the
- 51.1K (All time)
- 21 (Last 30 days)
- 4.5 / 5
- Community
-
19 Nov 2010

Finds peaks or troughs in a vector or 2-D matrix.
pickpeaksPick peaks.Summarypickpeaks is similar to MATLAB's findpeaks in that it returns local peaks and their indices for the input X, but has some advantages It is faster (much faster for large
- 2.5K (All time)
- 5 (Last 30 days)
- 2.0 / 5
- Community
-
23 Nov 2023