
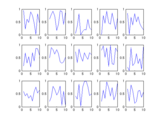
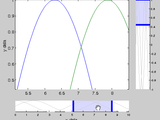
Plotting function that allows for N y-axes using a common x axis
This function allows for results to be plotted on N separate y-axes. These y-axes share a common x axis, but do not need to share exactly the same x/y data or size. The function supports all
- 3.4K (All time)
- 13 (Last 30 days)
- 4.9 / 5
- Community
-
11 Aug 2019
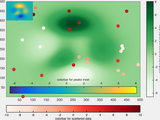
newcolorbar: multiple colormaps in the same axes
Create multiple colormaps and colorbars in (seemingly) the same set of axes.
This function creates a new set of invisible axes matching the size and extents of the current axes. This allows additional colormaps to be used in such a way that they are perceived as multiple
- 1.3K (All time)
- 2 (Last 30 days)
- 5.0 / 5
- Community
-
16 Aug 2015

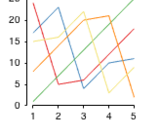
Add multiple y-axes to plots. zoomable with zoom modification.
Adds multiple axes to plots using addaxis.m. Automatically adjusts axes to accomodate as many axes as you want.Add more plots to any added axes with addaxisplot.mAdd y-labels to any of the axes with
- 36.9K (All time)
- 35 (Last 30 days)
- 4.4 / 5
- Community
-
7 Jul 2016

Display multiple images on individual axes and optionally link them
imagecat generates a 'catalog' of images useful for visualizing steps in image processing.
) with each image on its own axes. The axes can be optionally linked, set to be proportional in X and Y, or displayed in cartesian orientation.
- 681 (All time)
- 1 (Last 30 days)
- 5.0 / 5
- Community
-
7 Feb 2013
make plots with multiple x-axes
Something like plotyy (or any of its variants), but with any number of x-axes and (perhaps) a more flexible interface.
- 229 (All time)
- 1 (Last 30 days)
- 5.0 / 5
- Community
-
14 Nov 2017

Create axes object with multiple y-axis in Figure or App Designer
Object orientated approach for creating plots with three or more y axis. myaxisc, short for "Multiple Y Axis Class", is a class holding all the axes objects needed to display multiple Y axis. Second
- 1.1K (All time)
- 3 (Last 30 days)
- 4.9 / 5
- Community
-
6 Feb 2019

This function helps to create 2 axes in 1 colorbar
Two axes in one colorbar are achieved in this function. This code is a modified version of https://in.mathworks.com/matlabcentral/answers/475762-colormap-utility-two-axes-in-colorbar
- 47 (All time)
- 1 (Last 30 days)
- -- / 5
- Community
-
19 Aug 2020

Combined Legend for multiple axes
Provide an array of axes handles or 1 figure handle.It will create a legend of all the lines in axes
A simple demo to show how you can obtain the children object handles in plot determine their type and do something with it.If you have multiple axes in one figure but wish to have one legend for all
- 399 (All time)
- 1 (Last 30 days)
- -- / 5
- Community
-
15 Mar 2012

Data cursors for figure window
Data cursor support for multiple axes in a fugure
Several related functions:CreateCursor sets up a vertical cursor on all axes in a figure. The cursors can be moved around using the mouse.Multiple cursors are supported in each
- 4.6K (All time)
- 3 (Last 30 days)
- 4.6 / 5
- Community
-
24 May 2011

- 7.3K (All time)
- 2 (Last 30 days)
- 4.5 / 5
- Community
-
30 Aug 2002
Keyboard-navigation in Multiple Figures/Axes
By keyboard control it is possible to.
If you have multiple figures (or one) with multiple axes (graphs) (or one) which all have the same (or similar) x-axis (time, frequency, order, ...), this function makes it possible to navigate (zoom
- 2K (All time)
- 1 (Last 30 days)
- -- / 5
- Community
-
8 Aug 2002

The toolbox converts 2D & 3D MATLAB plots to the METAPOST or Multi-METAPOST format.
of FoilTEX, PPower4 or beamer packages, etc.The toolbox can convert following graphic objects: axes, line, text, patch, surface, image, and rectangle.Instalation and using is described in mmp.pdf.
- 1.1K (All time)
- 1 (Last 30 days)
- 4.5 / 5
- Community
-
5 Dec 2006

MULTIPLOTYYY allows the user to plot multiple lines on three sets of y-axes.
MULTIPLOTYYY plots using three sets of y-axes values. Additionally, multiple lines can be plotted against each y-axis. Therefore, the inputs to the function must be grouped into cell arrays.Here is
- 4.5K (All time)
- 4 (Last 30 days)
- 4.9 / 5
- Community
-
1 Sep 2016

MULTIWAITBAR displays multiple waitbars.
% MULTIWAITBAR displays multiple waitbars.% H = MULTIWAITBAR(NumAxes,StepAxes,TitleAxes)% creates and displays a waitbars of fractional lengths StepAxes. The% handle to the multiwaitbar figure
- 374 (All time)
- 1 (Last 30 days)
- 5.0 / 5
- Community
-
29 Oct 2013
Add as many legend you want to a single figure
This function allows to add multiple legends to a single figure / axes.Simply define the typical legend properties such as DisplayName, LineStyle, Color, ... and there you go.All additional settings
- 492 (All time)
- 2 (Last 30 days)
- 5.0 / 5
- Community
-
27 Sep 2013

Multiple Signal Routing to a Single-Axed Scope
Simple circuit for simulink amatuers
A simple circuit to illustrate how to display multiple signals on a scope display with only 1 axe using the 'Mux Block' function.
- 302 (All time)
- 1 (Last 30 days)
- -- / 5
- Community
-
6 Feb 2012
Produces an axis crosshair, allows user to click a point.
This function produces a crosshair on the axis selected. One can click to select an X, Y coordinate. This function can set up crosshairs on multiple axis across multiple figures. It can be modified
- 1.6K (All time)
- 2 (Last 30 days)
- 3.0 / 5
- Community
-
21 Nov 2005
Pans and zooms multiple axes on the same figure, with full control of axes linking.
Pan with left click mouse drag, draw a zoombox with right click drag, and view all data with double-click. This also retains any existing WindowButtonXFcn the figure has, as well as any axes
- 942 (All time)
- 1 (Last 30 days)
- -- / 5
- Community
-
24 Aug 2016

- 1.4K (All time)
- 1 (Last 30 days)
- 3.8 / 5
- Community
-
12 Oct 2011

Add multiple X or Y axes to plots, rescale data, use any function, add data tips, zoom, flexible.
This package will allow you to plot data on multiple X or Y axis. Similar to MATLAB's own plotyy function, but less limiting. Features: Create any combination of X or Y axes, plot multiple lines on
- 2.2K (All time)
- 1 (Last 30 days)
- 3.7 / 5
- Community
-
9 Dec 2015

Plotting data on multiple y-axes in the same figure for MATLAB.
addy_axisA new take on plotting data across multiple y-axes in MATLAB. Creates a pair of visible/invisible axes: the invisible one is used to overlay data with the existing main axes, while the
- 25 (All time)
- 2 (Last 30 days)
- -- / 5
- Community
-
19 Jul 2024

Custom colorbar with multiple entries
CCBAR creates a custom colorbar with multiple sections. The contents of the CCBar are given as an input, and can consist of one or more arrays of indexed or RGB color data. In addition, setting the
- 419 (All time)
- 1 (Last 30 days)
- -- / 5
- Community
-
17 Feb 2011

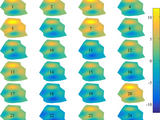
Five Degree-of-Freedom Grain Boundary Interpolation
Fast Gaussian Process Regression (GPR) interpolation of small and large grain boundary property datasets in a 5 degree-of-freedom sense.
trianglesphtri_subdiv_test.msqrt2norm.mtake a set of octonions and give each row norm == sqrt(2) if (norm == 1) || (norm == sqrt(2))sqrt2norm_r2018a.margumentssymaxis.mReturn the symmetry axes (if multiple) and the geometry given a
- 125 (All time)
- 2 (Last 30 days)
- -- / 5
- Community
-
5 Feb 2022

xPlot – Behaves Like Plot But With Built-in Tools for Interactively Displaying/Filtering Metadata
Easily Display/Filter Metadata In Multiple Figures, Axes, Lines With Built-in Tools. Extensible.
- 87 (All time)
- 1 (Last 30 days)
- 5.0 / 5
- Community
-
3 Jul 2018

- 43 (All time)
- 1 (Last 30 days)
- -- / 5
- Community
-
18 Apr 2020

Multiple data sets are managed and compared with the mouse, by shifting objects and axes
: props to Paul S. Koch for the inspiration with uilineshift.m!possible improvements, to be posted at a later release:-ability to select and move multiple lines ('group')-highlighting selected
- 1K (All time)
- 1 (Last 30 days)
- -- / 5
- Community
-
19 Oct 2010
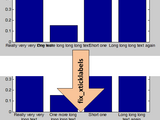
fix_xticklabels - automatically convert xticklabels to multiple line format
It will determine maximum allowed width of XTickLabels and convert them into multiple line format
FIX_XTICKLABELS will determine maximum allowed width of long XTickLabels and convert them into multiple line format to fit maximum allowed width IN: handle [optional] - axes handle
- 3.2K (All time)
- 1 (Last 30 days)
- 4.9 / 5
- Community
-
22 Sep 2014
With one click, zoom axes for better visibility.
What if you have a number of tiny subplots or images in a figure window and would like to be able to visually inspect them?Call allowaxestogrow(f) on a figure f with any number of sub-axes
- 3.2K (All time)
- 1 (Last 30 days)
- 4.5 / 5
- Community
-
15 May 2009
Multiple matrix multiplications, with array expansion enabled
Multiplying matrices, vectors, or scalars contained in two N-D arrays, with array expansion enabled.
with multidimensional arrays.MULTIPROD performs multiple multiplications between matrices, vectors, or scalars contained in two multidimensional arrays, with automatic virtual array expansion (AX
- 9.9K (All time)
- 3 (Last 30 days)
- 4.9 / 5
- Community
-
26 Jul 2010
multiple colon-intervals
Return a concatenation of multiple colon-intervals.User provides left, step, and right bound.>> mcolon([0 10],[1 2],[2 14])ans = 0 1 2 10 12 14
- 1.1K (All time)
- 1 (Last 30 days)
- 5.0 / 5
- Community
-
3 Jan 2011
Vectorized version of hold function.
VHOLD(multiax, onoff) set hold state of multiple axes. VHOLD(multiax, onoff) is a vectorized version of function hold. It sets the states of multiple axes objects with handles in matrix multiax
- 228 (All time)
- 1 (Last 30 days)
- -- / 5
- Community
-
10 May 2012
tight_subplot(Nh, Nw, gap, marg_h, marg_w)
Fills the figure with axes subplots with easily adjustable margins and gaps between the axes.
Subplot tends to leave a lot of empty space around the axes. Tight_subplot allows to adjust the spacing between the axes as well as the margins around the axes.For example:[ha, pos] =
- 56.7K (All time)
- 48 (Last 30 days)
- 4.7 / 5
- Community
-
3 Mar 2016
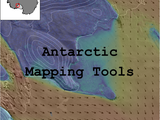
A toolbox for analysis and display of Antarctica-related data
framework to allow easy pairing of multiple different types of data sets (surface elevation, ice velocity, grounding line, etc). For a quick overview, check the Examples tab on this page and click "AMT
- 6.3K (All time)
- 9 (Last 30 days)
- 5.0 / 5
- Community
-
4 May 2026

Change the visual appearance of a figure axis, by separating the axes at the origin.
Matlab function to change the visual appearance of a figure axis, by separating the axes at the origin. Usage: SeparateAxes SeparateAxes(..., hAxis) SeparateAxes(..., fProportion
- 126 (All time)
- 1 (Last 30 days)
- 5.0 / 5
- Community
-
16 Aug 2017
Import fig file to axes
% IMPORTFIG(Figfilename,Axes) opens a fig file and places the% contents into another axes such as on a subplot.% % Example% h=subplot(3,2,1); % importfig('plot1.fig',h); Useful if you have lots as
- 5.7K (All time)
- 2 (Last 30 days)
- 4.6 / 5
- Community
-
1 Sep 2016

Plots multiple images in same axes, showing background, where foreground is NaN.
Imagescn plot two or more imagesc into the same axes. Deeper layers are visible, were higher layers have the value NaN. This is helpful e.g. to show measurement (=foreground) results "above" a map
- 2.7K (All time)
- 1 (Last 30 days)
- 2.0 / 5
- Community
-
6 Mar 2007

Detect and Track Multiple Faces
Detect and track multiple faces from live video.
This is a simple system for detecting and tracking multiple faces from live video. It uses the Computer Vision System Toolbox and the Webcam Support Package. The system detects faces using the
- 12.9K (All time)
- 4 (Last 30 days)
- 4.7 / 5
- Community
-
1 Sep 2016
ScrollPlot - scrollable X/Y axes
ScrollPlot adds a scroll sub-window to any supplied plot handles
ScrollPlot adds a scroll sub-window to any supplied plot handles (or current [gca] axes if no handle was supplied). This enables easy plot or image exploration. The user can specify initial view
- 10.5K (All time)
- 3 (Last 30 days)
- 4.8 / 5
- Community
-
16 Jul 2015

Set functions with multiple inputs
Intersectm, ismemberm, setdiffm, setxorm, unionm with multiple inputs. Ex: intersectm(a,b,c,…).
Have you ever tried to find the common elements/rows to more than two sets without using a loop?Now you can with multiple-input set functions: Intersectm, ismemberm, setdiffm, setxorm, unionm.Brief
- 1.6K (All time)
- 1 (Last 30 days)
- 5.0 / 5
- Community
-
6 Aug 2010
Multiple same-size linear solver
Solve multiple systems of linear equations of the same size
- 3.6K (All time)
- 2 (Last 30 days)
- 5.0 / 5
- Community
-
26 May 2010

Cursor feature for MATLAB® plots
MYCURSORS creates as many cursors as you want on an axes.Cursors can be tricky to implement and handle. This function will help you to simply add multiple cursors on an axes.EXAMPLE:Take a look at
- 2.4K (All time)
- 1 (Last 30 days)
- 5.0 / 5
- Community
-
21 Jun 2007

Adds a new class for creating nested axes that show zoomed-in regions of a 2D plot
# Matlab Zoomed AxesAdds a new class for creating nested axes that show zoomed-in regions of a 2D plot.Supports multiple zoomed axes per parent and is fully interactive for easy placement. ##
- 879 (All time)
- 15 (Last 30 days)
- 5.0 / 5
- Community
-
14 Nov 2025
Offset axes, mimicks Seaborn's 'despine' option for plotting
visible. This function mimics the behaviour in a matlab plot, by changing the axis limits and covering the origin of the axes with a white line.
- 720 (All time)
- 2 (Last 30 days)
- 4.7 / 5
- Community
-
9 Nov 2016

Plot a set of data with two different axes.
PLOT2AXES(X, Y, 'Param1', 'Value1', ...) plots X versus Y with secondary axes. The following parameters are accepted [default values]: xloc ['top']: location of secondary X-axis yloc ['right
- 8.6K (All time)
- 2 (Last 30 days)
- 3.6 / 5
- Community
-
1 Sep 2016

mplot: Multiple plots in a single figure with list box selection
Adds multiple plot instructions to a figure and the user chooses which one to use from a list box.
mplot creates a figure with a list box and axes. The list box contains references to plot instructions to sketch data on the axes. Plot instructions are added to the list box with successive calls to
- 1.7K (All time)
- 2 (Last 30 days)
- 5.0 / 5
- Community
-
2 Oct 2010
- 5.5K (All time)
- 2 (Last 30 days)
- 4.8 / 5
- Community
-
1 Nov 2004

Program to create a figure with multiple tabs and demo their use.
This function creates a figure with multiple Tabs. The number of tabs can be changed and they are distributed evenly across the top of the figure. Content is provided for the first 5 tabs to demo
- 11.2K (All time)
- 1 (Last 30 days)
- 4.9 / 5
- Community
-
4 Feb 2014
Multicore - Parallel processing on multiple cores
This package provides parallel processing on multiple cores/machines.
This package provides parallel processing on multiple cores on a single machine or on multiple machines that have access to a common directory.If you have multiple function calls that are independent
- 21.3K (All time)
- 9 (Last 30 days)
- 4.8 / 5
- Community
-
21 Jul 2014
This is just a simple utility function to find all subplots in a figure and link their axes.
Syntax is the same as linkaxes, except without passing in the handles to the axes to link. It replaces: figure; ax(1) = subplot(2,1,1); plot(rand(10,1)); ax(2) =
- 621 (All time)
- 1 (Last 30 days)
- 4.3 / 5
- Community
-
6 Jan 2012
Link the axes of different figures for zoom and pan
The function is similar to Matlab's linkaxes, only it takes figure numbers instead of axes handles.Use the function when you want to zoom and pan multiple axes that are not on the same figure (i.e
- 1.1K (All time)
- 2 (Last 30 days)
- 5.0 / 5
- Community
-
15 Sep 2009
Subplots without extra space in their twixt.
simpler to use. Try 'em all and see what works best for you. The name smplot comes from Edward Tufte's small multiples.
- 663 (All time)
- 1 (Last 30 days)
- 5.0 / 5
- Community
-
11 Sep 2015

plotSeries - Color-code multiple plots
plotSeries allows multiple plots to be easily color-coded
used for the plot. The colorList output can be used directly as the colormap argument for other calls to plotSeries, providing a mechanism to easily produce multiple plots using similar coloring schemes
- 411 (All time)
- 1 (Last 30 days)
- 5.0 / 5
- Community
-
17 Oct 2011

Multiple XY Graph for Simulink®
This is an XY-Graph block that is based on the Level-2 MATLAB S-Function API to plot multiple trajectories. The zip file contains the associated S-function and an example model.
- 1.4K (All time)
- 3 (Last 30 days)
- 5.0 / 5
- Community
-
6 May 2020

ticklabelformat - set a dynamic format of axes tick labels
ticklabelformat sets the axes tick labels format. The format is preserved during zoom/pan/maximize
ticklabelformat sets the format of an axes tick labels based on sprintf format specifiers. The format is preserved during zoom/pan/maximize and applied to the dynamic tick values. Calling
- 2.5K (All time)
- 1 (Last 30 days)
- 4.5 / 5
- Community
-
27 Jun 2015

Click any axes to expand it in a separate figure. Right-click expanded axes to export contents!
FUNCTION EXPANDAXES(HNDLS)Allows you to click on any axes (or child thereof) in the list of input handles. Left-clicking will popup a new window in the position of the original, filled with the
- 3.1K (All time)
- 3 (Last 30 days)
- 4.9 / 5
- Community
-
1 Sep 2016

Myplotyy plots different data sets with a common x-axis but using individual y-axes in one figure.
Myplotyy plots different data sets with a common x-axis but using individual y-axes in one figure. The properties of every curve (y-axis) can be individually adjusted, such as linear or logarithmic
- 3.2K (All time)
- 2 (Last 30 days)
- 4.7 / 5
- Community
-
12 May 2011

Generate n 'well-spaced' axes -- uniform sampling of 3D rotation axes
Generates n axes-of-rotation that are 'well-spaced', that is all axes are as far from being parallel as possible. The resulting axes minimize clustering. This is one way to generate a uniform
- 454 (All time)
- 1 (Last 30 days)
- 5.0 / 5
- Community
-
10 Dec 2013
Superimpose multiple semitransparent images with individual colormaps on the current axis.
Remaps CData for multiple images, plotted in the current axis, to their respective individual colormaps. Multiple examples provided. The examples also demonstrate how semitransparent effects can be
- 1.2K (All time)
- 1 (Last 30 days)
- 5.0 / 5
- Community
-
3 Mar 2012

Violin Plots for plotting multiple distributions (distributionPlot.m)
Function for plotting multiple histograms side-by-side in 2D - better than boxplot.
(http://www.mathworks.com/matlabcentral/fileexchange/37105).DistributionPlot allows visualizing multiple distributions side by side. It is useful for skewed unimodal data and indispensable for multimodal data. DistributionPlot is especially useful for showing the time
- 14.8K (All time)
- 11 (Last 30 days)
- 5.0 / 5
- Community
-
11 Feb 2017