43 results
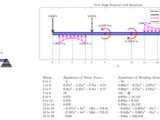
This function SFBM.m calculates and draw the shear force and bending moment diagrams.
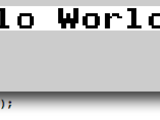
text2im.m converts a passed text string to a matrix which contains the the string as an image (simpl
Text2Im converts a passed string to a bw-image.Often it is necessary to burn in annotations in evaulated images. Since I didn't found an easy solution to do so, I wrote this programm to generate an

Sloan Visual Acuity Eye Chart Optotype

Put text into the corner of an image in order to make their presentation better.
image.This function works with the neat function text2im.m, Convert text to an image, developed by Tobias Kiessling(Tboias Kiessling 2021). This function I modificate just the first part because gave me an

Convert text to image
text2im documentationTable of contentsDescription section:DescriptionFontsMatlab/Octave section:SyntaxOutput argumentsInput argumentsCompatibility, version info, and licenceDescriptionThis function

Other_MEM_Text2Im converts a passed string, color, width, & height to a colored image.
Other_MEM_Text2Im converts a passed string, color, width, & height to a colored image.I used the file "text2im.m" in this url

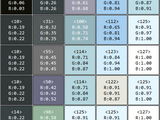
Convert image pixels to HTML table showing pixel colors and values
im2html produces HTML text containing a table that displays the image pixel colors and values. When called with no output argument, im2html displays the HTML in the MATLAB Web Browser. When called

Convert text string to RGB image (quickly) by using a dictionary of pre-generated images.
Two functions str2im and str2imq.str2im: Convert text string to RGB image.% str2im %display example text% str2im(str) %text as char array or cellstr% str2im(str,pad) %margin: [N] or

Generate finite element mesh based on 2D or 3D multi-phase image. For image-based finite element analysis.
"Im2mesh_Octave". 20 examples are provided. If you're using MATLAB, examples are live script mlx files (demo01.mlx ~ demo20.mlx). If you find some text in the mlx file is missing, please read the html file instead
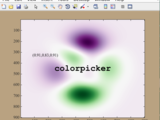
Get RGB values of any point(s) on a figure from mouse click(s)
colorpicker gets RGB values from mouse clicks anywhere on a figure. PressReturn to exit. % Syntax colorpicker colorpicker(256) colorpicker(...,TextProperty,TextValue) RGB = colorpicker(...) [R,G,B
When you have desired text in PDF documents saved in many folders
*: https://www.mathworks.com/matlabcentral/fileexchange/19798-extract-text-from-a-pdf-documentOpen files in multiple folders: https://www.mathworks.com/matlabcentral/answers/245959-how-to-read-text-files-from-different-sub-folders-in-a-folder1. Download the code2. Insert the file path for your
open multiple images and preform multiple ROIs process
series. 2) Usage: [roi, im] = mmROI; (please don't forget to add a semicolon ";" at the end of this command. Otherwise, all image data will be showing onscreen!) a) The statistic data are in roi structures

Plot one or more lines with a shaded boundary (can represent error, confidence intervals, etc).
plot.```matlabfigure;he = errorbar(x,y,b(:,1), b(:,2), '-bo');line([x([10 20 30 40]); x([10 20 30 40])], [ones(1,4)*-2;ones(1,4)*2], ...'color', ones(1,3)*0.5, 'linestyle', ':');text(x(10), sin(x(10))-0.2
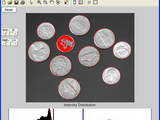
manual_thresh interactively select intensity levels band for image thresholding
it) but it has some more features:1. The possibility to choose a band of intensities rather than only the low threshold level.2. Editable texts and sliders were added to facilitate the use.3. The
'bwlargestblob' reads in a 2-d binary image and outputs a binary image, retaining only the largest b
connectivityoutim - Output binary image (with 1s and 0s)Example:im = imread('text.png');outim = bwlargestblob(im,8);figure; subplot(1,2,1); imshow(im);subplot(1,2,2); imshow(255*outim);

Novel Method for Determining Symmetry of Skin Lesions using the Jaccard Index
Version 1.0.0.0
Tyler CoyeThis Script is useful in finding symmetry lines in Skin Lesions with extensions to any binary masks.
imread('test3.jpg');im = im2double(I);% Convert RGB to Gray via PCAlab = rgb2lab(im);f = 0;wlab = reshape(bsxfun(@times,cat(3,1-f,f/2,f/2),lab),[],3);[C,S] = pca(wlab);S = reshape(S,size(lab));S = S(:,:,1);gray =
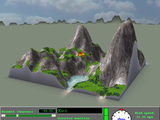
Staker is a 3-D artillery game inspired by Tank Wars and Scorched Earth.
fix recently. If you issue the command "feature('JavaFigures',0)", the button background colors will display as they should, although the formatting of other uicontrols and text will change a little too
Replace text / images in a Microsoft Word .docx file, no dependencies
editor.listImages();editor.replaceImage(filenames_images{1}, im);im2 = uint8(rand(256,256,1)*255);im_std2 = std(single(im2(:)));editor.replaceText("%mainstd2%", sprintf('%0.5f', im_std2));editor.replaceText("%figure2%", 'grey noise');imwrite(im2

matlab multiBandBlender implementation
imread('data/medium17.JPG');imshowpair(img1,img2,"montage")```这2幅图像有比较大的亮度差异,特别是曝光有明显不同。单应矩阵计算代码展开## 计算单应矩阵使用典型传统的orb特征点算法和匹配,就可以得到从图像2到图像1的转换矩阵,该矩阵即单应矩阵包含在tform变量中。```matlabgray1 = im2gray(img1);gray2 = im2gray(img2);pts1 = detectORBFeatures(gray1);pts2 =
C2Mat allows OpenCV data structures to be transferred between C++ and Matlab.
and a Matlab window will run in separate threads. Using a COM interface, Matlab allows external programs (such as C2Mat) to access it. Using C2Mat to send text commands from your program will have the
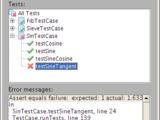
A MATLAB unit test framework supporting new classdef files (r2008a)
ability to add tests via a multiselect file dialog, for quick and easy use.For those of you who prefer to run headless, there is also a simple text test runner with a clear API.A note of explanation: when

Overlay one greyscale image in colour atop another, e.g. for medical imaging, simply.
_overlay. These have to have the same in-plane size (i.e. size(im_underlay,1)==size(im_overlay,1); size(im_underlay,2)==size(im_overlay,2)). The result is a colour image of overlay superimposed on underlay, with

Create paper-quality vector graphics geometry diagrams in 2D and 3D
options.```MATLABfilename = "file_name.gif";clear imfor i = 1:N % Code here frame = getframe(h_fig); im{i} = frame2im(frame);endfor idx = 1:length(im) [A, map] = rgb2ind(im{idx}, 256); if idx == 1

Pretrained XFeat(Accelerated Features for Lightweight Image Matching) MATLAB Model
imread("https://raw.githubusercontent.com/cuixing158/multiBandBlender/main/data/medium17.JPG");gray1 = im2gray(imgColor1);gray2 = im2gray(imgColor2);%% traditional feature matcht1 = tic;[matchedPoints1,matchedPoints2] = detectAndMatchPoints(gray1,gray2,"orb"); % or use "sift" ,"harris"t =

sets icons in the system-tray of your computer's desktop & enables setting/getting icon properties
that ICONIMAGE may be an image filename, or any image format accepted by Matlab's im2java function. ICONIMAGE may also be a two-arg pair [X,Map] (indexed image & color map). handle = SYSTRAY(ICON

Converts 2D axes data to image
Run ax2im to convert 2D axes data to imageHybrid format: Legends, titles, labels, ticks & text left as isUseful for exporting figures with a large number of datapoints as "pdf" w/ vector graphics
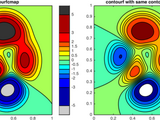
Creates a filled contour plot, with more precise control over colors than contourf.
`, etc.):```matlabcontourfcmap-pkg/FEX-function_handlecontourfcmap-pkg/arclengthcontourfcmap-pkg/contourcscontourfcmap-pkg/contourfcmapcontourfcmap-pkg/distance2curvecontourfcmap-pkg/fillnancontourfcmap-pkg/interparccontourfcmap-pkg/minmaxcontourfcmap-pkg/multiplepolyintcontourfcmap-pkg/parsepvcontourfcmap-pkg/pcolorbar```## Syntax```matlabcontourfcmap(x,y,z,clev,cmap)contourfcmap(x,y,z,clev,cmap, Name, Value)h = contourfcmap

Write MATLAB 2D or 3D finite element mesh to popular mesh file formats (for software Abaqus, Nastran, COMSOL, Gmsh)
writeMesh is a MATLAB project for writing MATLAB finite element mesh to inp, bdf, and msh files. writeMesh is a part of Im2mesh package. Tested in MATLAB R2017b.writeMesh supports mesh with single or

A simple visulization function with a beautiful 3D model of Fourier field
function Fourier3D() try img = im2double(imread('afile')); catch % Fallback to another built-in image if 'peppers' is not found. img = im2double(imread('afile')); end
Bedmap3 tools for MATLAB
these functions you'll need two things: 1. The `bedmap3.nc` data file, which can be found [here](https://doi.org/10.5285/2d0e4791-8e20-46a3-80e4-f5f6716025d2), and 2. [Antarctic Mapping Tools for
Some simple programs and a script, that could be usefull using "Trajectories of eigenvalues"
(The comments in the program are in italian, I'm sorry.)In this archive there are just some simple functions about matrices, expecially to be used with the program perteig.m called "Trajectories of

LLM-based Document Summarizer: Leveraging Hugging Face API for Efficient Text Processing
generate your API key.- Save your API key in a text file named `API_KEY.txt` in the same directory as the MATLAB script.### 2. Set Up Your MATLAB Script1. Clone or download the repository.2. Open MATLAB and

A parametric wing generator for 2- and 3-element wings to fit within a defined box.
** field and toggle to whichever file format you'd like. Then you can click **Save** to save the curve file(s) and a text file containing the wing parameters.## What are all these input options?Play around
This function calculates the Color (C) score for ABCD calculation of skin lesions.
),... boundary(:,1),'g','LineWidth',2); hold on himage = imshow(im);set(himage, 'AlphaData', 0.5);text(0,-10,strcat('\color{red}\fontsize{12}Estimated Color Score:',num2str(Finalscore)))endend
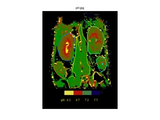
Averages the spectra associated with a particular region of a bmp Raman map image
pixels as you have spectra in the map2. use file->multidataset save to export the full list of spectra as txt files dirvar is the path to the directory containing the text files, Im is the bmp image

How to use impedance data to estimate the Equivalent Circuit Model (ECM) parameters of a battery.
imaginary part of ZreZ = real(Z);imZ = imag(Z);% Save the resultssave("ImpedanceData.mat","imZ","reZ","freq");```Below figure shows the synthetically generated impedance data.
This is a simple (untested, so YMMV) interactive application to evaluate image segmentation using various metrics.
evaluation## Metrics Explanation### Dice Similarity Coefficient (DSC)Measures the overlap between two segmentations:$$\text{DSC} = \frac{2|X \cap Y|}{|X| + |Y|}$$Range: 0 to 1 (or 0 to 100 in percentage)- 1.0
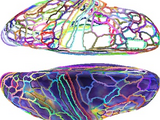
MATLAB toolbox for visualizing brain data on surfaces.
visualization capabilities include the ability to modulate the transparency of surface maps by other maps, and to represent two to three surface maps on one mesh using 2-D (square) and 3-D (cube) colormaps. It

This functions acts as an API for the Wayback Machine (web.archive.org).
capture that is as close to the midpoint of the matching range as possible. So for date_part='2' the range is 2000-01-01 00:00 to 2999-12-31 23:59:59, meaning the WBM will attempt to return the capture

activate nos secure telegram novelty hcj124-81-107500 data file sec treasuries nih 09267883 security Live media Component network ppi 00
ipp.192-7-7-4.369.query.gtatic/emulated.networking.lib.online.internet.browser.vlc.olan/discover.fda.implanted.devices/fqa7b128-fec4-4607-ald9.gstatic/sftp-ssh_tcp.local storage/little court safety protocol listeners 84216990/614e module/7f130008 Im O 10302 Federal/T#-21134659206/ Holl-Cj 26 S FBI O29540577 Agent 979130 NCO , 2
Matlab projects and associated import/export media, data, etc.
You can also select a web site from the following list
Americas
- América Latina (Español)
- Canada (English)
- United States (English)
Europe
- Belgium (English)
- Denmark (English)
- Deutschland (Deutsch)
- España (Español)
- Finland (English)
- France (Français)
- Ireland (English)
- Italia (Italiano)
- Luxembourg (English)
- Netherlands (English)
- Norway (English)
- Österreich (Deutsch)
- Portugal (English)
- Sweden (English)
- Switzerland
- United Kingdom (English)
Asia Pacific
- Australia (English)
- India (English)
- New Zealand (English)
- 中国
- 日本Japanese (日本語)
- 한국Korean (한국어)