| Products & Services | Solutions | Academia | Support | User Community | Company |
| Download Product Updates | | | Get Pricing | | | Trial Software |
| Documentation → MATLAB |
| Contents | Index |
| Learn more about MATLAB |
![]()
ezsurf(fun)
ezsurf(fun,domain)
ezsurf(funx,funy,funz)
ezsurf(funx,funy,funz,[smin,smax,tmin,tmax])
ezsurf(funx,funy,funz,[min,max]
ezsurf(...,n)
ezsurf(...,'circ')
ezsurf(axes_handle,...)
h = ezsurf(...)
ezsurf(fun) creates a graph of fun(x,y) using the surf function. fun is plotted over the default domain: -2π < x < 2π, -2π < y < 2π.
fun can be a function handle for an M-file function or an anonymous function (see Function Handles and Anonymous Functions) or a string (see the Remarks section).
ezsurf(fun,domain) plots fun over the specified domain. domain must be a vector. See the Algorithm section for details on vector inputs vs axes limit outputs.
ezsurf(funx,funy,funz) plots the parametric surface funx(s,t), funy(s,t), and funz(s,t) over the square: -2π < s < 2π, -2π < t < 2π.
ezsurf(funx,funy,funz,[smin,smax,tmin,tmax]) or ezsurf(funx,funy,funz,[min,max]) plots the parametric surface using the specified domain.
ezsurf(...,n) plots fun over the default domain using an n-by-n grid. The default value for n is 60.
ezsurf(...,'circ') plots fun over a disk centered on the domain.
ezsurf(axes_handle,...) plots into the axes with handle axes_handle instead of the current axes (gca).
h = ezsurf(...) returns the handle to a surface object in h.
ezsurf and ezsurfc do not accept complex inputs.
Array multiplication, division, and exponentiation are always implied in the expression you pass to ezmesh. For example, the MATLAB syntax for a surface plot of the expression
sqrt(x.^2 + y.^2);
is written as
ezsurf('sqrt(x^2 + y^2)')That is, x^2 is interpreted as x.^2 in the string you pass to ezsurf.
If the function to be plotted is a function of the variables u and v (rather than x and y), then the domain endpoints umin, umax, vmin, and vmax are sorted alphabetically. Thus, ezsurf('u^2 - v^3',[0,1],[3,6]) plots u2 - v3 over 0 < u < 1, 3 < v < 6.
Function handle arguments must point to functions that use MATLAB syntax. For example, the following statements define an anonymous function and pass the function handle fh to ezsurf.
fh = @(x,y) sqrt(x.^2 + y.^2); ezsurf(fh)
Note that when using function handles, you must use the array power, array multiplication, and array division operators (.^, .*, ./) since ezsurf does not alter the syntax, as in the case with string inputs.
If your function has additional parameters, for example k in myfun:
function z = myfun(x,y,k1,k2,k3) z = x.*(y.^k1)./(x.^k2 + y.^k3);
then you can use an anonymous function to specify that parameter:
ezsurf(@(x,y)myfun(x,y,2,2,4))
ezsurf does not graph points where the mathematical function is not defined (these data points are set to NaNs, which do not plot). This example illustrates this filtering of singularities/discontinuous points by graphing the function
![]()
over the default domain -2π < x < 2π, -2π < y < 2π:
ezsurf('real(atan(x+i*y))')
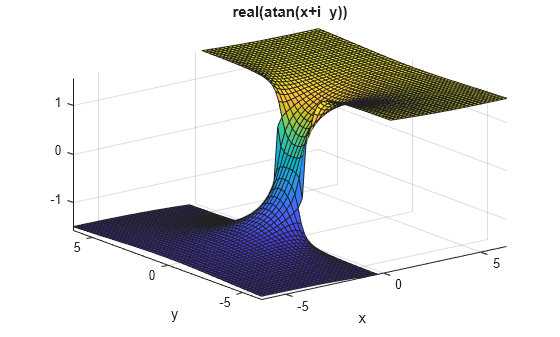
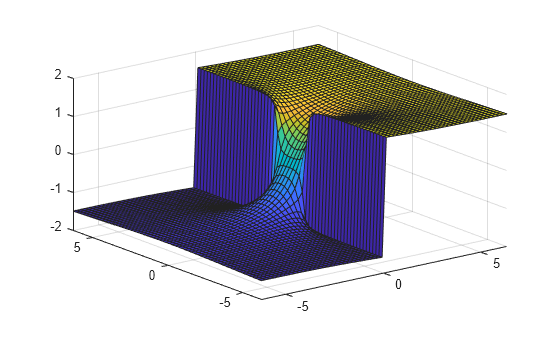
Using surf to plot the same data produces a graph without filtering of discontinuities (as well as requiring more steps):
[x,y] = meshgrid(linspace(-2*pi,2*pi,60)); z = real(atan(x+i.*y)); surf(x,y,z)

Note also that ezsurf creates graphs that have axis labels, a title, and extend to the axis limits.
ezsurf determines the x- and y-axes limits in different ways depending on how you input the domain (if at all). In the following table, R is the vector [xmin, xmax, ymin, ymax] and v is the manually entered domain vector.
| Number of domain values specified: | Resulting domain vector: |
|---|---|
| v = [ ]; | R = [-2*pi, 2*pi, -2*pi, 2*pi]; |
| v = [ v(1) ]; | R = double([-abs(v),abs(v),-abs(v),abs(v)]); |
| v = [ v(1) v(2) ]; | R = double([v(1),v(2),v(1),v(2)]); |
| v = [ v(1) v(2) v(3) ]; | R = double([-v(1),v(2),-abs(v(3)),abs(v(3))]); |
| v = [ v(1) v(2) v(3) v(4) ]; | R = double(v); |
| v = [ v(1)..v(n) ]; n>4 | R = double([-abs(v(1)), abs(v(1)), -abs(v(1)), abs(v(1))]); |
If you specify a single number in non-vector format (without square brackets, [ ]), ezsurf interprets it as the n, the number of points desired between the axes max and min values.
By default, ezsurf uses 60 points between
the max and min values of an
axes. When the min and max values
are the default values (R = [-2*pi, 2*pi, -2*pi, 2*pi];), ezsurf ensures
the 60 points fall within the non-complex range of the specified equation.
For example,
is only real when
. The default graph
of this function looks like this:
ezsurf('sqrt(1-x^2-y^2)')

You can see that there are 60 points
between the minimum and maximum values for which
has real values. However, when
you specify the domain values to be the same as the default (R
= [-2*pi, 2*pi, -2*pi, 2*pi];), a different result appears:
ezsurf('sqrt(1-x^2-y^2)',[-2*pi 2*pi])

In this case, the graphic limits are the same, but ezsurf used 60 points between the user-defined limits instead of checking to see if all those points would have real answers.
ezmesh, ezsurfc, function_handle, surf
Function Plots for related functions
![]() | ezpolar | ezsurfc | ![]() |

Includes the most popular MATLAB recorded presentations with Q&A sessions led by MATLAB experts.
| © 1984-2009- The MathWorks, Inc. - Site Help - Patents - Trademarks - Privacy Policy - Preventing Piracy - RSS |