histc
(Not recommended) Histogram bin counts
histc is not recommended. Use histcounts instead.
For more information, including suggestions on updating code, see Replace Discouraged Instances of hist and histc.
Description
bincounts = histc(x,binranges)x that are within each specified bin range.
The input, binranges, determines the endpoints for each bin. The output,
bincounts, contains the number of elements from x in each
bin.
If
xis a vector, thenhistcreturnsbincountsas a vector of histogram bin counts.If
xis a matrix, thenhistcoperates along each column ofxand returnsbincountsas a matrix of histogram bin counts for each column.
To plot the histogram, use bar(binranges,bincounts,'histc').
Examples
Initialize the random number generator to make the output of randn repeatable.
rng(0,'twister')Define x as 100 normally distributed random numbers. Define bin ranges between -4 and 4. Determine the number of values in x that are within each specified bin range. Return the number of elements in each bin in bincounts.
x = randn(100,1);
binranges = -4:4;
[bincounts] = histc(x,binranges)
bincounts = 9×1

     0
     2
    17
    28
    32
    16
     3
     2
     0
To plot the histogram, use the bar function.
figure
bar(binranges,bincounts,'histc')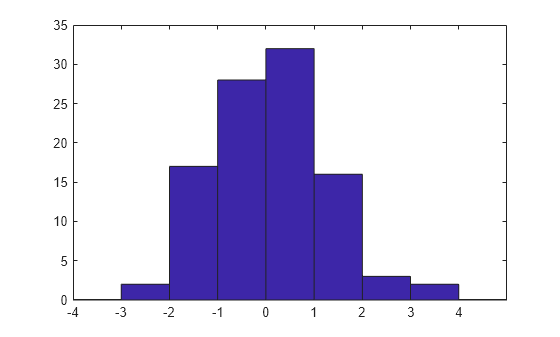
Defined ages as a vector of ages. Sort ages into bins with varying ranges between 0 and 75.
ages = [3,12,24,15,5,74,23,54,31,23,64,75];
binranges = [0,10,25,50,75];

[bincounts,ind] = histc(ages,binranges)
bincounts = 1×5

     2     5     1     3     1
ind = 1×12

     1     2     2     2     1     4     2     4     3     2     4     5
bincounts contains the number of values in each bin. ind indicates the bin numbers.
Input Arguments
Output Arguments
Tips
If values in
xlie outside the specified bin ranges, thenhistcdoes not include these values in the bin counts. Start and end thebinrangesvector with-infandinfto ensure that all values inxare included in the bin counts.
Extended Capabilities
Version History
Introduced before R2006a
See Also
bar | hist | mode | histogram | histcounts