linkaxes
Synchronize limits of multiple axes
Description
linkaxes( synchronizes the limits of the
specified vector of axes. Synchronizing limits allows you to zoom or pan in one plot or
figure and display the same range of data in another plot or figure. When you first call the
ax)linkaxes function, it chooses new limits that incorporate the current
limits of all the specified axes.
Before R2026a: When you call the linkaxes
function, all links created by previous calls to the function are canceled. For example, if
you call linkaxes([ax1 ax2]) and then linkaxes([ax2
ax3]), the second call cancels the link between ax1 and
ax2.
Examples
Display a tiling of plots using the tiledlayout and nexttile functions.
Create a 3-by-1 tiled chart layout by using the tiledlayout function. Then, create the axes objects ax1, ax2, and ax3 by using the nexttile function and plot into each axes object.
tiledlayout(3,1)

% First plot
ax1 = nexttile;
x1 = linspace(0,6);
y1 = sin(x1);
plot(x1,y1)

% Second plot
ax2 = nexttile;
x2 = linspace(0,10);
y2 = 2*sin(2*x2);
plot(x2,y2)

% Third plot
ax3 = nexttile;
x3 = linspace(0,12,200);
y3 = 4*sin(6*x3);
plot(x3,y3)
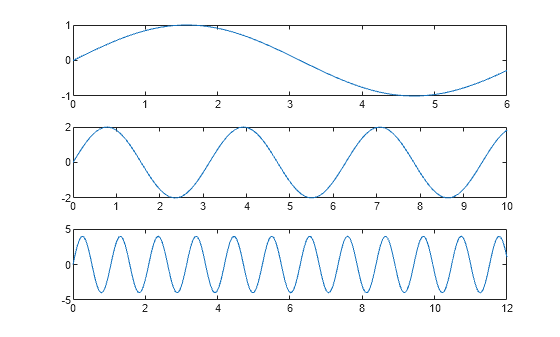
Synchronize the axes limits of the three plots. Note that the new axes limits incorporate the old limits.
linkaxes([ax1 ax2 ax3])
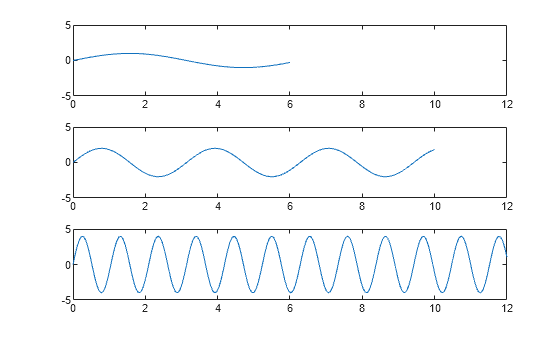
Set the x-axis limits for the first plot. All of the x-axes are linked, so the x-axis limits in the second and third plots also change.
ax1.XLim = [0 4.5];
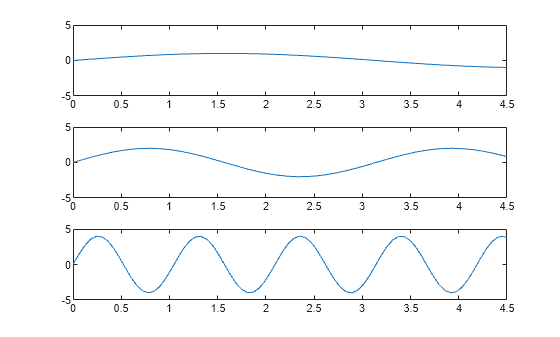
Panning or zooming into one of the plots displays the same range of data in the other two plots.
To remove the linking, use linkaxes([ax1 ax2 ax3],"off").
Synchronize and modify the x-axis limits of multiple axes objects by using the linkaxes function.
Display a tiling of plots using the tiledlayout and nexttile functions. Create a 2-by-1 tiled chart layout by using the tiledlayout function. Then, create the axes objects ax1 and ax2 by using the nexttile function and plot into each axes object.
t = tiledlayout(2,1);

% First plot
ax1 = nexttile;
p1 = peaks;
surf(ax1,p1)
view(3)

% Second plot
ax2 = nexttile;
p2 = peaks(25);
mesh(ax2,p2)
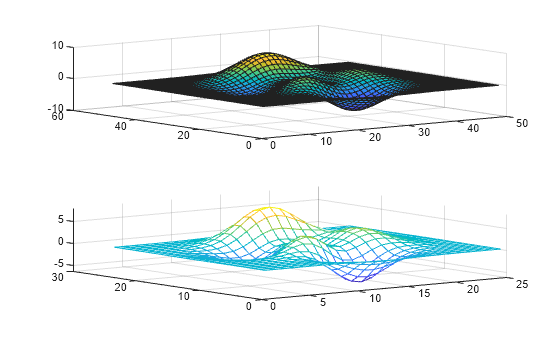
Synchronize the x-axis limits for the two axes objects. The x-axis limits for the newly linked axes objects update to encompass all the data.
linkaxes([ax1 ax2],"x")Update the x-axis limits for all linked axes objects by setting the x-axis limits for just one of the axes objects.
ax1.XLim = [0 15];
ax2.XLim
ans = 1×2

     0    15
Remove the linking by turning off synchronization.
linkaxes([ax1 ax2],"off")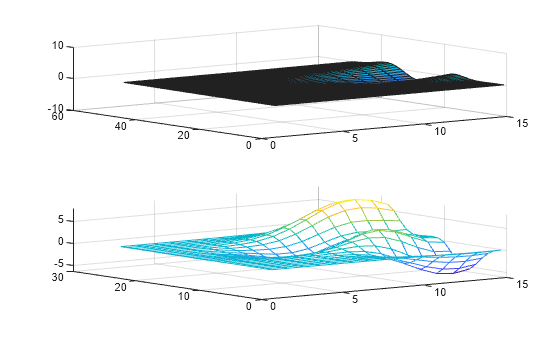
When comparing two plots of datetime values in different time zones, set the ReferenceDate property of one of the rulers so that both plots reflect the same time zone.
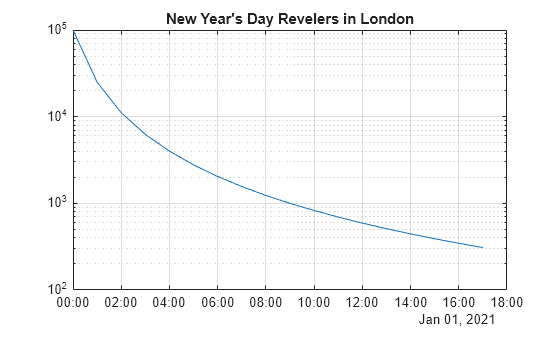
Create a tiling of two plots that compare the number of New Year's Day revelers in London and New York on January 1, 2021. Start by plotting the London data in the first tile. By default, the plot uses the time zone of the data.
London = datetime(2021,1,1,0:17,0,0,"TimeZone","Europe/London");
y = (1./(1:18).^2) * 100000;
ax1 = nexttile;
semilogy(ax1,London,y)
grid on
title("New Year's Day Revelers in London")
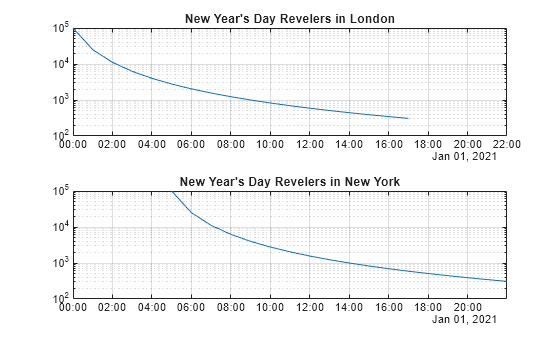
Plot the New York data. This second plot is in the time zone of New York, so you cannot easily compare the number of revelers across the two locations at the same point in time by visual inspection.
NY = datetime(2021,1,1,0:17,0,0,"TimeZone","America/New_York");
ax2 = nexttile;
semilogy(ax2,NY,y)
grid on
title("New Year's Day Revelers in New York")

Change the time zone for the New York plot by setting the reference date of the x-axis to a datetime value in the time zone of "Europe/London". Then link the two axes. As a result, both plots reflect the same time zone.
ax2.XAxis.ReferenceDate = datetime(2022,1,1,"TimeZone","Europe/London");
linkaxes([ax1,ax2],"x")
Input Arguments
Version History
Introduced before R2006aSee Also
linkprop | linkdata | tiledlayout | nexttile