linkprop
Keep same value for corresponding properties of graphics objects
Syntax
hlink = linkprop(obj_handles,'PropertyName')
hlink = linkprop(obj_handles,{'PropertyName1','PropertyName2',...})
Description
Use linkprop to maintain the same values
for the corresponding properties of different graphics objects.
Note
Use linkprop only with graphics objects.
hlink = linkprop(obj_handles,' maintains
the same value for the property PropertyName') PropertyName on
all objects whose handles appear in obj_handles. linkprop returns
the link object in hlink. See About Link Objects for
more information.
hlink = linkprop(obj_handles,{' maintains
the same respective values for all properties passed as a cell array
on all objects whose handles appear in PropertyName1','PropertyName2',...})obj_handles.
MATLAB® updates the linked properties of all linked objects
immediately when linkprop is called. The first
object in the list obj_handles determines the property
values for the other objects.
A set of graphics objects can have only one link object connecting
their properties at any given time. Calling linkprop creates
a new link object. This new link object replaces any existing link
object that is associated with the objects specified in obj_handles.
However, you can manage which properties and which objects are linked
by calling methods on that object:
To add an object to the list of linked objects, use the
addtargetmethod.To link new properties of currently-linked objects, use the
addpropmethod.To stop linking an object, use the
removetargetmethod.To stop properties from linking, use the
removepropmethod.
About Link Objects
The link object that linkprop returns stores
the mechanism that links the properties of different graphics objects.
Therefore, the link object must exist within the context where you
want property linking to occur (such as in the base workspace if users
are to interact with the objects from the command line or figure tools).
The following list describes ways to maintain a reference to the link object.
Return the link object as an output argument from a function and keep it in the base workspace while interacting with the linked objects.
Make the
hlinkvariable global.Store the
hlinkvariable in an object'sUserDataproperty or in application data.
Updating a Link Object
If you want to change either the graphics objects or the properties
that are linked, you need to use the link object methods designed
for that purpose. These methods are functions that operate only on
link objects. To use them, you must first create a link object using linkprop.
Method | Purpose |
|---|---|
addtarget | Add specified graphics object to the link object's targets. |
removetarget | Remove specified graphics object from the link object's targets. |
addprop | Add specified property to the linked properties. |
removeprop | Remove specified property from the linked properties. |
Method Syntax
addtarget(hlink,obj_handles)
removetarget(hlink,obj_handles)
addprop(hlink,'PropertyName')
removeprop(hlink,'PropertyName')
Method Arguments
hlink— Link object returned bylinkpropobj_handles— One or more graphic object handlesPropertyName— Name of a property common to all target objects
Examples
Link properties of two axes so that rotating one axes automatically rotates the other.
Create a figure with two axes and store the axes handles. Add plots to both axes.
figure
ax1 = subplot(2,1,1);
[X1,Y1,Z1] = peaks;
surf(X1,Y1,Z1)

ax2 = subplot(2,1,2);
[X2,Y2,Z2] = peaks(10);
surf(X2,Y2,Z2)
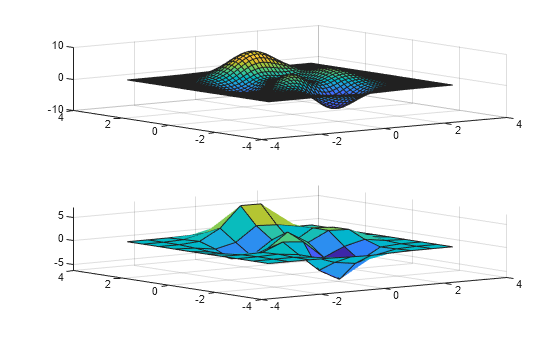
Link the CameraPosition and CameraUpVector properties of the axes and return the link object handle. Then, enable interactive rotation and use the mouse to rotate either axes. Rotating one axes automatically rotates the other in the same manner.
hlink = linkprop([ax1,ax2],{"CameraPosition","CameraUpVector"});
rotate3d on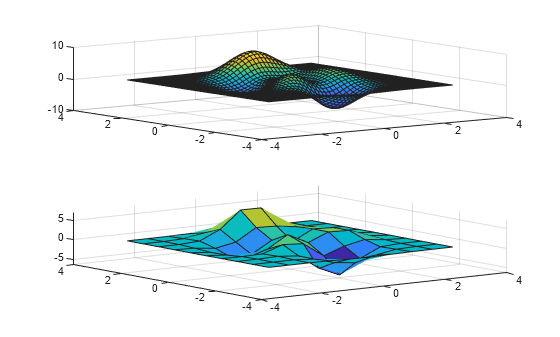
To disable interactive rotation, use rotate3d off.
Link an additional property by passing the link object handle and the property name to the addprop function.
addprop(hlink,'PlotBoxAspectRatio')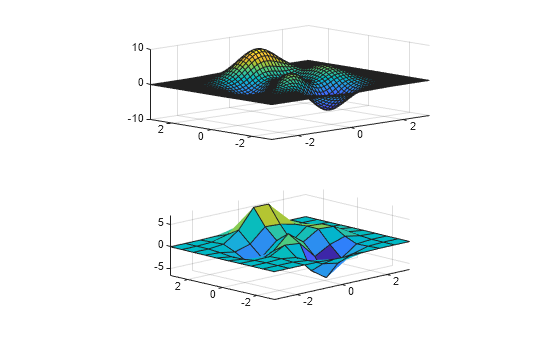
Version History
Introduced before R2006a
See Also
getappdata | ishghandle | linkaxes | linkdata | setappdata