peaks
Peaks function
Description
Return Coordinates
Z = peaks
Z = peaks(Xm,Ym)Xm
and Ym. The sizes of Xm and
Ym must be the same or be compatible. For example, you can specify Xm and
Ym as matrices in meshgrid format.
Create Surface Plot
peaks(___) plots the peaks function as a
three-dimensional surface plot. You can use any of the input argument combinations in the
previous syntaxes.
Examples
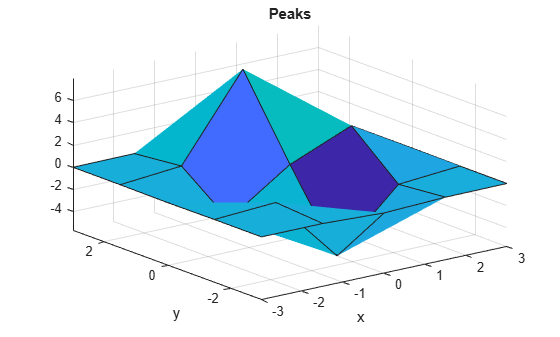
Create a 5-by-5 matrix of peaks and display the surface.
figure
peaks(5)
z =  3*(1-x).^2.*exp(-(x.^2) - (y+1).^2) ...
   - 10*(x/5 - x.^3 - y.^5).*exp(-x.^2-y.^2) ...
   - 1/3*exp(-(x+1).^2 - y.^2)
Evaluate the peaks function over a 2-D grid that is defined by uniformly spaced values in the interval [-1,1].
n = -1:0.25:1;
Z = peaks(n)
Z = 9×9

    1.8559    2.4537    2.2247    0.9965   -0.7239   -2.0151   -2.2222   -1.4251   -0.2729
    1.7829    3.0862    3.6265    2.9423    1.3962   -0.0048   -0.4134    0.2037    1.1760
    0.7969    2.4879    3.5507    3.3044    1.9975    0.7001    0.3896    1.1388    2.1978
   -0.5659    1.2281    2.5614    2.6254    1.5850    0.5256    0.4756    1.4962    2.7556
   -1.6523    0.0636    1.4796    1.7530    0.9810    0.1904    0.3744    1.5728    2.9369
   -2.1491   -0.6469    0.6823    1.0566    0.5228   -0.0281    0.2795    1.4682    2.7624
   -1.9968   -0.7599    0.3898    0.7963    0.4641    0.0898    0.3754    1.3442    2.3768
   -1.1629   -0.0458    1.0400    1.5519    1.4226    1.1205    1.1713    1.6492    2.1708
    0.2289    1.5069    2.7942    3.5855    3.6886    3.3404    2.9344    2.6622    2.4338
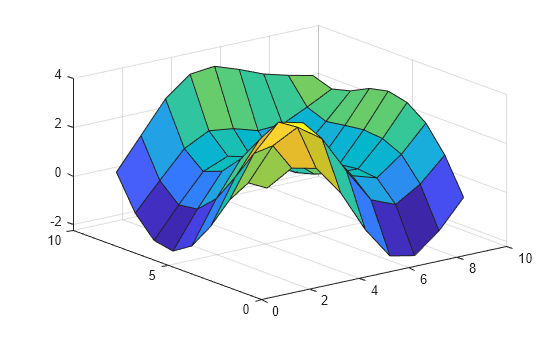
Use the calculated values to create a three-dimensional surface plot.
surf(Z)
Create 2-D grid coordinates with x-coordinates defined by the vector x and y-coordinates defined by the vector y.
x = -2:0.5:2;
y = 1:0.2:2;
[X,Y] = meshgrid(x,y);
Evaluate the peaks function over the 2-D grid.
Z = peaks(X,Y)
Z = 6×9

   -0.4808   -0.8639    0.2289    2.7942    3.6886    2.9344    2.4338    1.5813    0.5805
   -0.2470   -0.1924    1.4275    4.5254    5.8902    4.6339    2.8647    1.3897    0.4382
   -0.0730    0.3116    2.3394    5.8525    7.5679    5.9243    3.2006    1.2552    0.3350
    0.0320    0.5860    2.7339    6.2839    8.1000    6.3260    3.2091    1.1050    0.2561
    0.0764    0.6437    2.5958    5.7476    7.3967    5.7698    2.8374    0.9069    0.1901
    0.0797    0.5539    2.0967    4.5569    5.8591    4.5675    2.2099    0.6771    0.1328
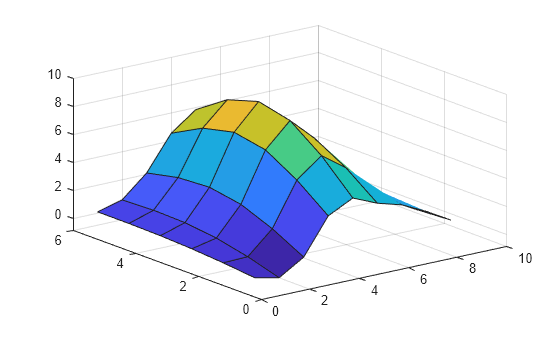
Use the calculated values to create a three-dimensional surface plot.
surf(Z)
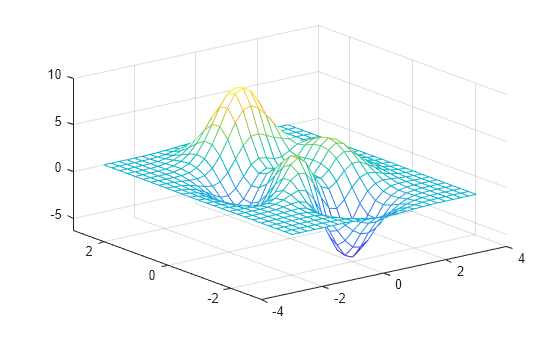
Use the peaks function to create three matrices of the same size. Then, plot them as a mesh plot.
[X,Y,Z] = peaks(25);
mesh(X,Y,Z)
Input Arguments
Output Arguments
More About
Version History
Introduced before R2006a