refreshdata
Refresh charted data
Description
refreshdata updates charted data in the current figure to reflect
changes in workspace variables. Before using refreshdata, you must
first set the data source properties (for example, XDataSource) of the
charts. The function evaluates these data sources before updating the charts.
Examples
Refresh charted data to reflect changes in workspace variables.
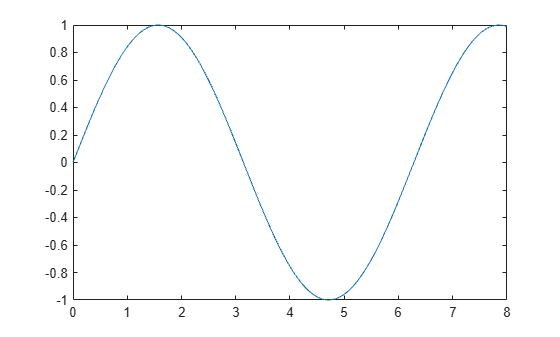
First, plot some data and return a Line object.
x = linspace(0,8);
y = sin(x);
ln = plot(x,y);
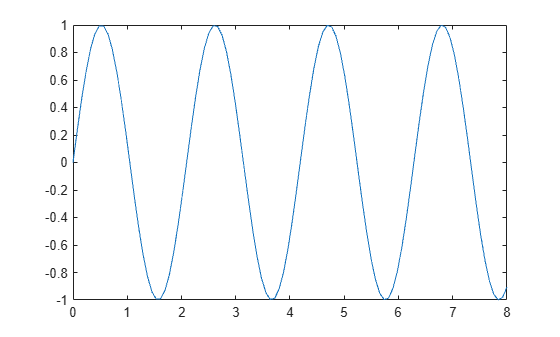
Identify the data sources for the chart by setting the XDataSource and YDataSource properties of the Line object. Then, modify y. Update the chart by calling refreshdata.
ln.XDataSource = 'x';
ln.YDataSource = 'y';
y = sin(3.*x);

refreshdata
Refresh charted data for a specific line and leave other lines unchanged.
First, plot two sets of polar data and return the Line objects.
theta = linspace(0,2*pi);
rho1 = sin(theta);
rho2 = -sin(theta);

px = polaraxes;
hold on;
ln1 = polarplot(theta,rho1);
ln2 = polarplot(theta,rho2);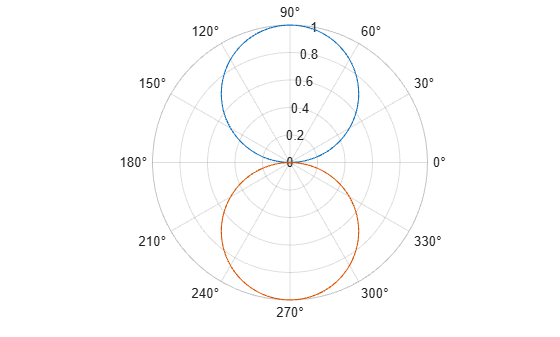
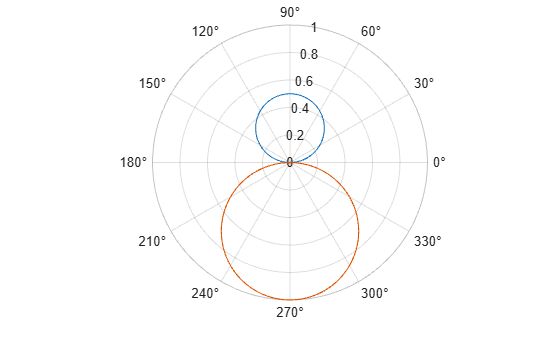
Set the RDataSource property for each line. Then, modify rho1 and rho2.
ln1.RDataSource = 'rho1';
ln2.RDataSource = 'rho2';

rho1 = 0.5*sin(theta);
rho2 = 0.5*cos(theta);
Update only the first line by using ln1 as the input argument to refreshdata. Note that the second line remains unchanged.
refreshdata(ln1)
Input Arguments
Version History
Introduced before R2006a